Die Zentrale Tendenz Statistikumfasst wichtige Konzepte wie Zentralwert, Modalwert...
Statistik einfach erklärt: Zentrale Tendenz, Streuungsmaße, Häufigkeit und Kreisdiagramme
1
of 1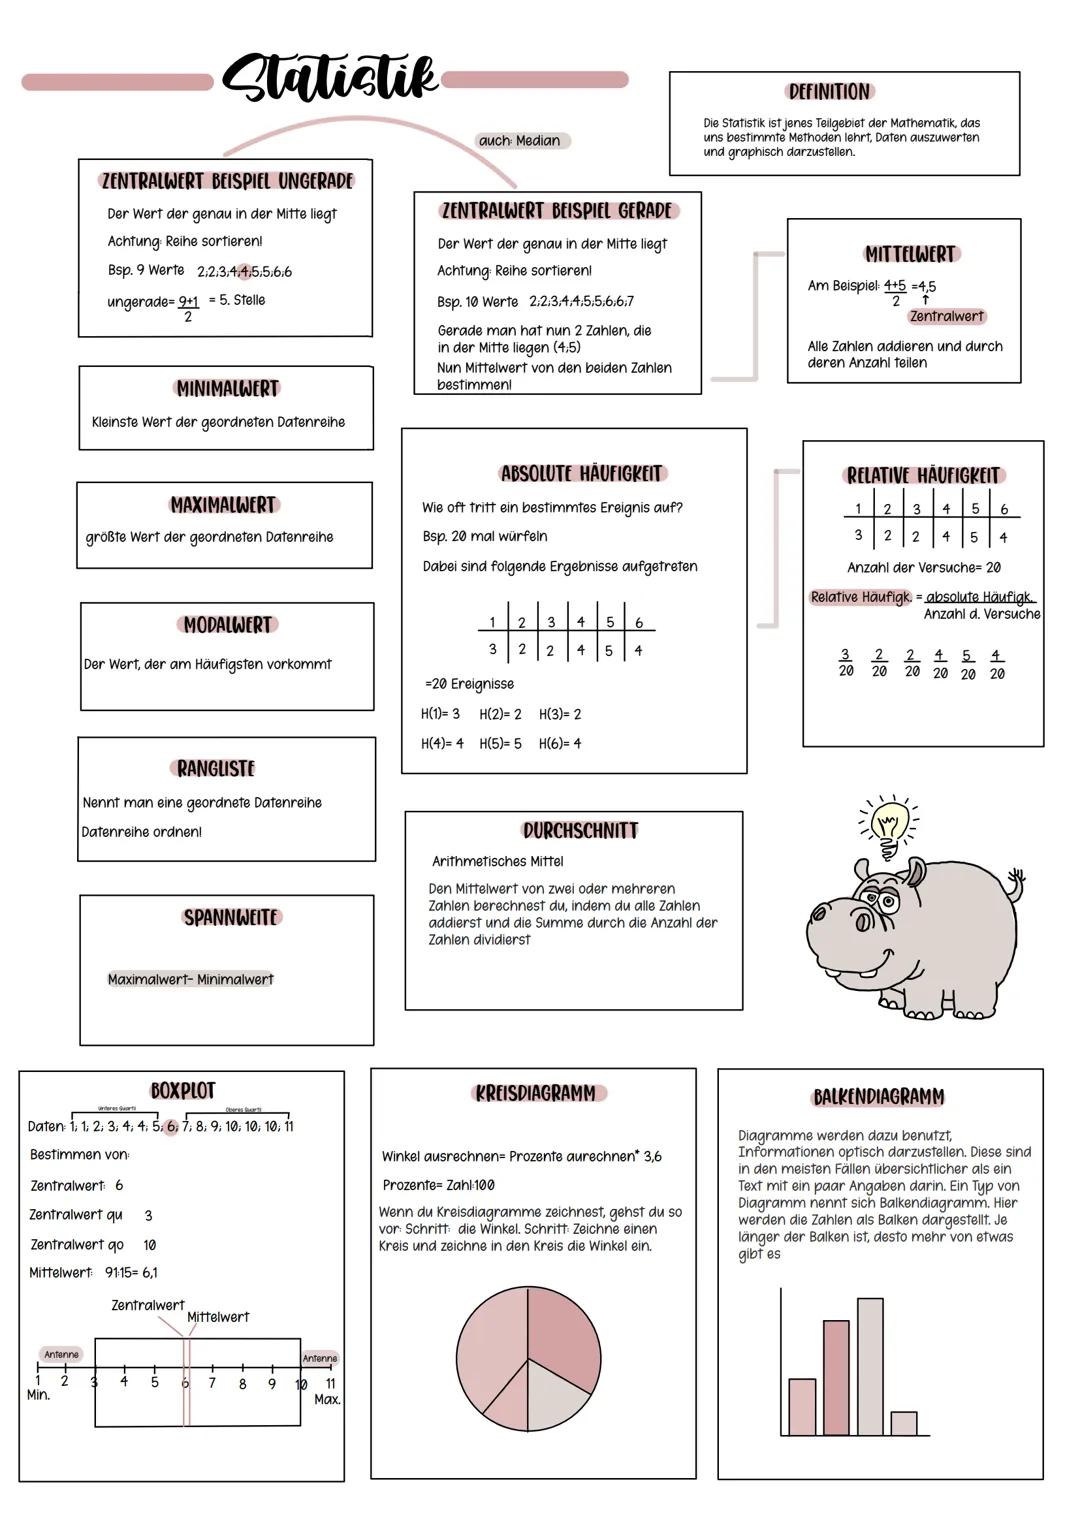
Zentrale Tendenz und statistische Grundlagen
Diese Seite bietet einen umfassenden Überblick über grundlegende Konzepte der Zentrale Tendenz Statistik und verwandte statistische Methoden. Sie erklärt verschiedene Maße der zentralen Tendenz wie Zentralwert (Median), Modalwert und Mittelwert sowie deren Berechnung anhand von Beispielen. Zusätzlich werden wichtige Streuungsmaße wie Spannweite und Boxplot vorgestellt, die zur Beschreibung der Datenverteilung dienen. Die Seite behandelt auch die Berechnung von absoluten und relativen Häufigkeiten sowie die Erstellung verschiedener Diagrammtypen zur visuellen Darstellung statistischer Daten.
Definition: Die Statistik ist jenes Teilgebiet der Mathematik, das uns bestimmte Methoden lehrt, Daten auszuwerten und graphisch darzustellen.
Vocabulary: Der Zentralwert, auch Median genannt, ist der Wert, der genau in der Mitte einer geordneten Datenreihe liegt.
Example: Bei der Berechnung des Zentralwerts für eine ungerade Anzahl von Werten (z.B. 2,2,3,4,4,5,5,6,6) wird der mittlere Wert gewählt. Bei einer geraden Anzahl wird der Mittelwert der beiden mittleren Zahlen berechnet.
Highlight: Die relative Häufigkeit berechnet sich aus der absoluten Häufigkeit geteilt durch die Gesamtanzahl der Versuche. Sie kann in Prozent ausgedrückt werden und ist wichtig für die Wahrscheinlichkeitsrechnung.
Example: Beim Erstellen eines Kreisdiagramms wird der Winkel für jeden Sektor berechnet, indem man den Prozentwert mit 3,6 multipliziert. Ein vollständiger Kreis hat 360°, daher entspricht 1% einem Winkel von 3,6°.
Die Seite bietet praktische Anleitungen zur Berechnung und Interpretation verschiedener statistischer Kennzahlen. Sie erklärt, wie man einen Boxplot erstellt, absolute und relative Häufigkeiten berechnet und verschiedene Diagrammtypen wie Kreis- und Balkendiagramme zeichnet. Diese Informationen sind besonders nützlich für Schüler und Studenten, die die Grundlagen der Statistik erlernen und anwenden möchten.
We thought you’d never ask...
What is the Knowunity AI companion?
Our AI Companion is a student-focused AI tool that offers more than just answers. Built on millions of Knowunity resources, it provides relevant information, personalised study plans, quizzes, and content directly in the chat, adapting to your individual learning journey.
Where can I download the Knowunity app?
You can download the app from Google Play Store and Apple App Store.
Is Knowunity really free of charge?
That's right! Enjoy free access to study content, connect with fellow students, and get instant help – all at your fingertips.
Similar content
Most popular content in Mathe
9Most popular content
9Can't find what you're looking for? Explore other subjects.
Students love us — and so will you.
4.6/5App Store
4.7/5Google Play
The app is very easy to use and well designed. I have found everything I was looking for so far and have been able to learn a lot from the presentations! I will definitely use the app for a class assignment! And of course it also helps a lot as an inspiration.
Stefan SiOS user
This app is really great. There are so many study notes and help [...]. My problem subject is French, for example, and the app has so many options for help. Thanks to this app, I have improved my French. I would recommend it to anyone.
Samantha KlichAndroid user
Wow, I am really amazed. I just tried the app because I've seen it advertised many times and was absolutely stunned. This app is THE HELP you want for school and above all, it offers so many things, such as workouts and fact sheets, which have been VERY helpful to me personally.
AnnaiOS user
Statistik einfach erklärt: Zentrale Tendenz, Streuungsmaße, Häufigkeit und Kreisdiagramme
Die Zentrale Tendenz Statistikumfasst wichtige Konzepte wie Zentralwert, Modalwert und Mittelwert zur Datenanalyse. Der Zentralwert (Median) teilt eine geordnete Datenreihe in zwei gleiche Hälften. Der Modalwert ist der häufigste Wert in einem Datensatz. Der Mittelwert berechnet sich durch Addition...
1
of 1
Sign up to see the content. It's free!
- Access to all documents
- Improve your grades
- Join milions of students
Zentrale Tendenz und statistische Grundlagen
Diese Seite bietet einen umfassenden Überblick über grundlegende Konzepte der Zentrale Tendenz Statistik und verwandte statistische Methoden. Sie erklärt verschiedene Maße der zentralen Tendenz wie Zentralwert (Median), Modalwert und Mittelwert sowie deren Berechnung anhand von Beispielen. Zusätzlich werden wichtige Streuungsmaße wie Spannweite und Boxplot vorgestellt, die zur Beschreibung der Datenverteilung dienen. Die Seite behandelt auch die Berechnung von absoluten und relativen Häufigkeiten sowie die Erstellung verschiedener Diagrammtypen zur visuellen Darstellung statistischer Daten.
Definition: Die Statistik ist jenes Teilgebiet der Mathematik, das uns bestimmte Methoden lehrt, Daten auszuwerten und graphisch darzustellen.
Vocabulary: Der Zentralwert, auch Median genannt, ist der Wert, der genau in der Mitte einer geordneten Datenreihe liegt.
Example: Bei der Berechnung des Zentralwerts für eine ungerade Anzahl von Werten (z.B. 2,2,3,4,4,5,5,6,6) wird der mittlere Wert gewählt. Bei einer geraden Anzahl wird der Mittelwert der beiden mittleren Zahlen berechnet.
Highlight: Die relative Häufigkeit berechnet sich aus der absoluten Häufigkeit geteilt durch die Gesamtanzahl der Versuche. Sie kann in Prozent ausgedrückt werden und ist wichtig für die Wahrscheinlichkeitsrechnung.
Example: Beim Erstellen eines Kreisdiagramms wird der Winkel für jeden Sektor berechnet, indem man den Prozentwert mit 3,6 multipliziert. Ein vollständiger Kreis hat 360°, daher entspricht 1% einem Winkel von 3,6°.
Die Seite bietet praktische Anleitungen zur Berechnung und Interpretation verschiedener statistischer Kennzahlen. Sie erklärt, wie man einen Boxplot erstellt, absolute und relative Häufigkeiten berechnet und verschiedene Diagrammtypen wie Kreis- und Balkendiagramme zeichnet. Diese Informationen sind besonders nützlich für Schüler und Studenten, die die Grundlagen der Statistik erlernen und anwenden möchten.
We thought you’d never ask...
What is the Knowunity AI companion?
Our AI Companion is a student-focused AI tool that offers more than just answers. Built on millions of Knowunity resources, it provides relevant information, personalised study plans, quizzes, and content directly in the chat, adapting to your individual learning journey.
Where can I download the Knowunity app?
You can download the app from Google Play Store and Apple App Store.
Is Knowunity really free of charge?
That's right! Enjoy free access to study content, connect with fellow students, and get instant help – all at your fingertips.
Similar content
Most popular content in Mathe
9Most popular content
9Can't find what you're looking for? Explore other subjects.
Students love us — and so will you.
4.6/5App Store
4.7/5Google Play
The app is very easy to use and well designed. I have found everything I was looking for so far and have been able to learn a lot from the presentations! I will definitely use the app for a class assignment! And of course it also helps a lot as an inspiration.
Stefan SiOS user
This app is really great. There are so many study notes and help [...]. My problem subject is French, for example, and the app has so many options for help. Thanks to this app, I have improved my French. I would recommend it to anyone.
Samantha KlichAndroid user
Wow, I am really amazed. I just tried the app because I've seen it advertised many times and was absolutely stunned. This app is THE HELP you want for school and above all, it offers so many things, such as workouts and fact sheets, which have been VERY helpful to me personally.
AnnaiOS user