Statistics is everywhere - from predicting exam results to understanding...
AS Level Statistics Notes - Edexcel Year 1
A
a🖤@inactive_ax


1 / 10
1
of 10
Getting Started with Statistics
Statistics helps you make sense of the world around you by collecting and analysing data. Whether you're looking at exam results, social media trends, or scientific research, the methods you'll learn here are the foundation for understanding what the numbers actually mean.
The key is knowing how to collect good data and then interpret it properly. You'll discover different ways to gather information, measure what matters, and spot patterns that can help predict future outcomes.
2
of 10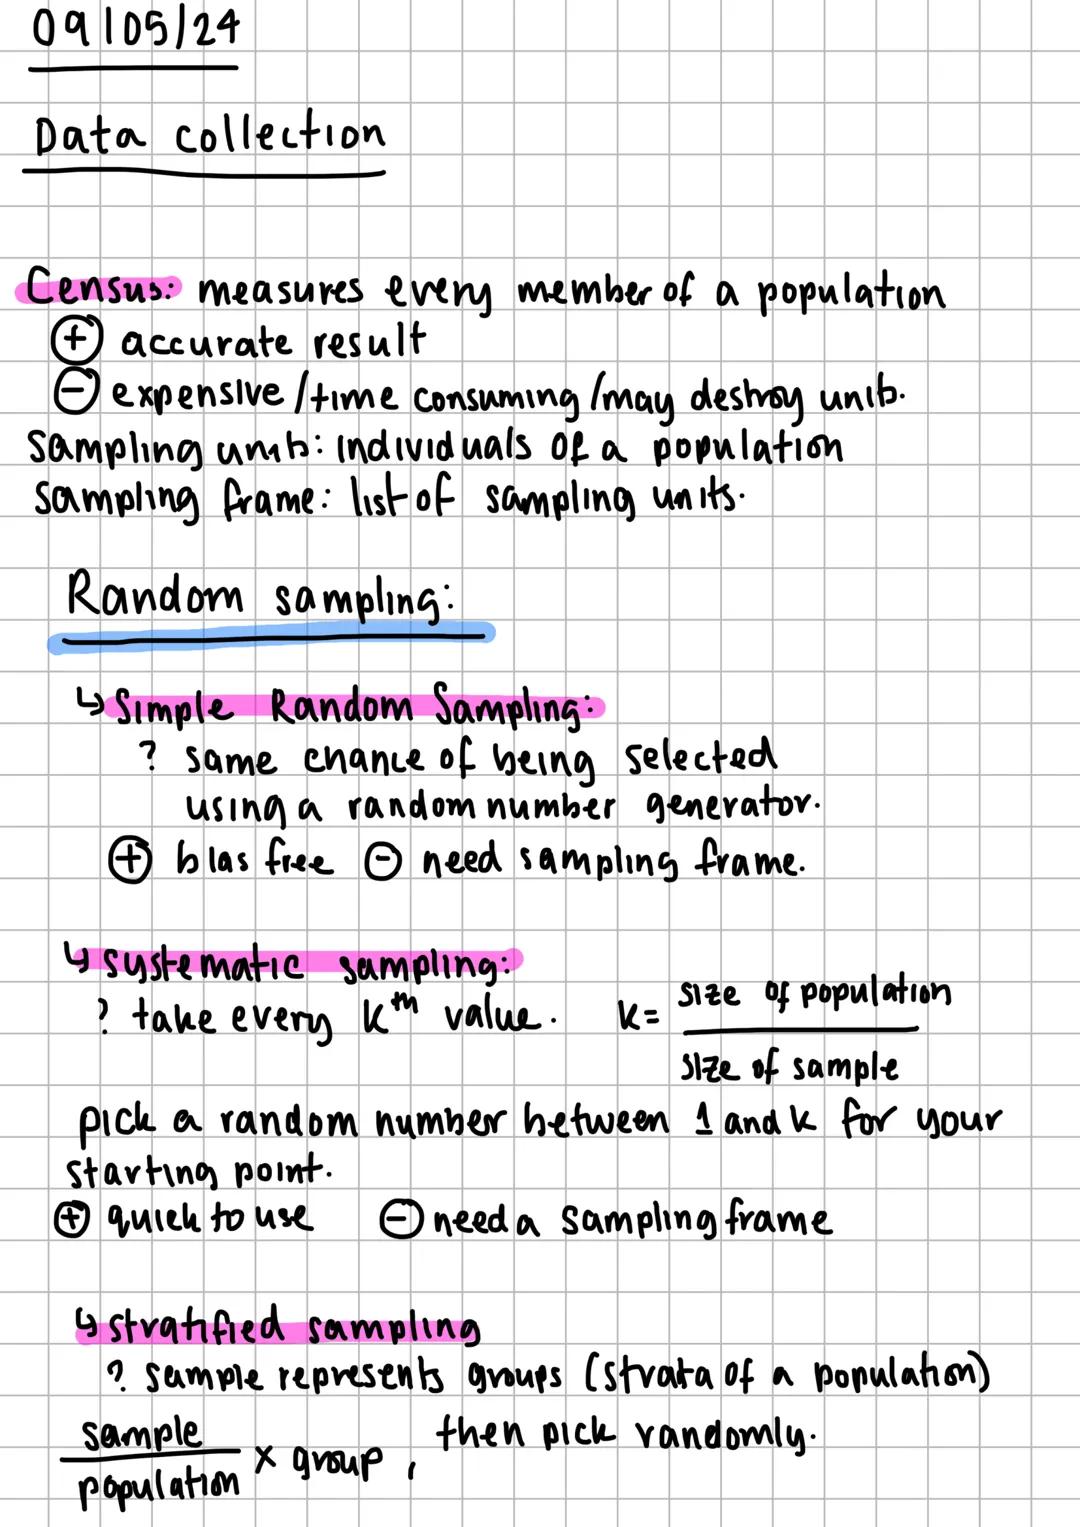
Data Collection Methods
Census vs sampling - that's your first big choice when collecting data. A census measures every single person in your population (like the UK national census), giving you perfect accuracy but costing loads of time and money.
Sampling is much more practical for most situations. You'll use a sampling frame (your list of potential participants) to select sampling units (the actual people you'll survey). Simple random sampling gives everyone an equal chance using a random number generator - it's completely unbiased but you need that complete list first.
Systematic sampling is brilliant when you want speed. Calculate k = population size ÷ sample size, pick a random starting point, then take every kth person. Stratified sampling ensures your sample represents different groups proportionally - work out (sample ÷ population) × group size, then randomly select within each group.
Quick tip: Random sampling methods eliminate bias but need complete lists, whilst non-random methods like quota and opportunity sampling are cheaper but potentially biased.
3
of 10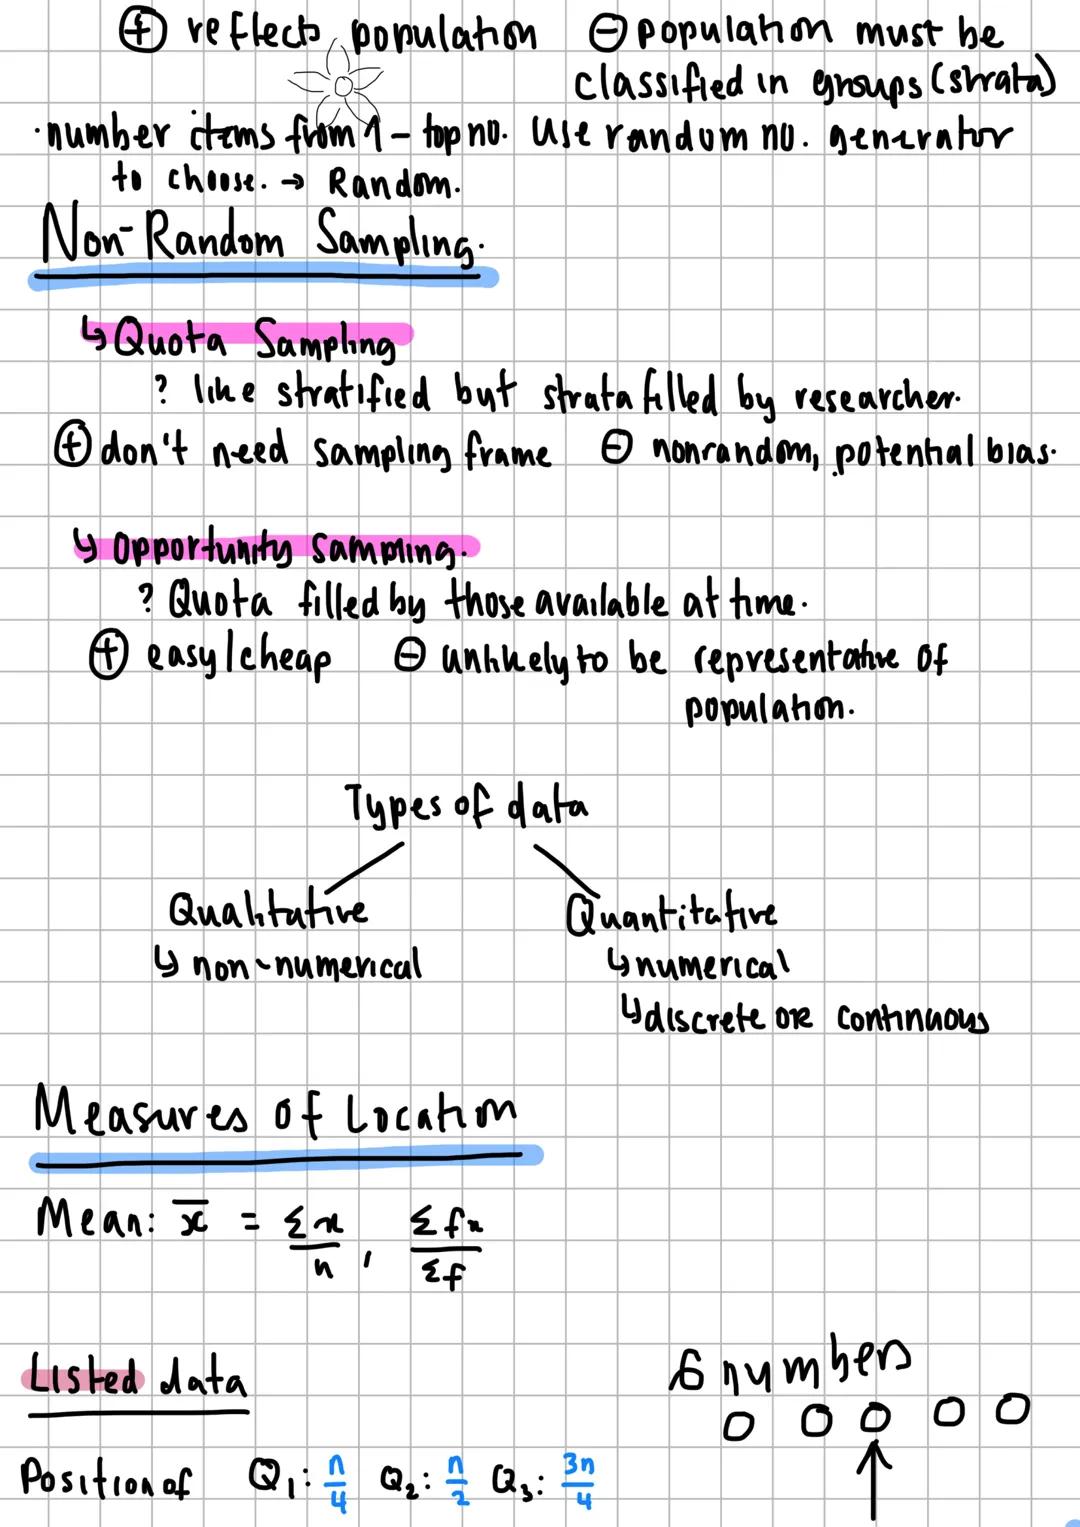
Non-Random Sampling and Data Types
Quota sampling works like stratified sampling, but researchers fill each group however they want - no random selection needed. It's dead easy since you don't need a complete sampling frame, but bias can creep in. Opportunity sampling just grabs whoever's available at the time - think surveying people outside Tesco. Super cheap and quick, but hardly representative of the whole population.
Data types matter loads for your analysis. Qualitative data describes qualities (like favourite colours or opinions), whilst quantitative data deals with actual numbers. Quantitative splits into discrete (whole numbers like number of siblings) and continuous (measurements like height that can be any value).
Understanding these differences helps you choose the right analysis methods later on. You can't calculate an average of favourite pizza toppings, but you absolutely can find the mean number of pets people own.
Remember: The sampling method you choose affects how trustworthy your results will be, so pick wisely based on your time, budget, and accuracy needs.
4
of 10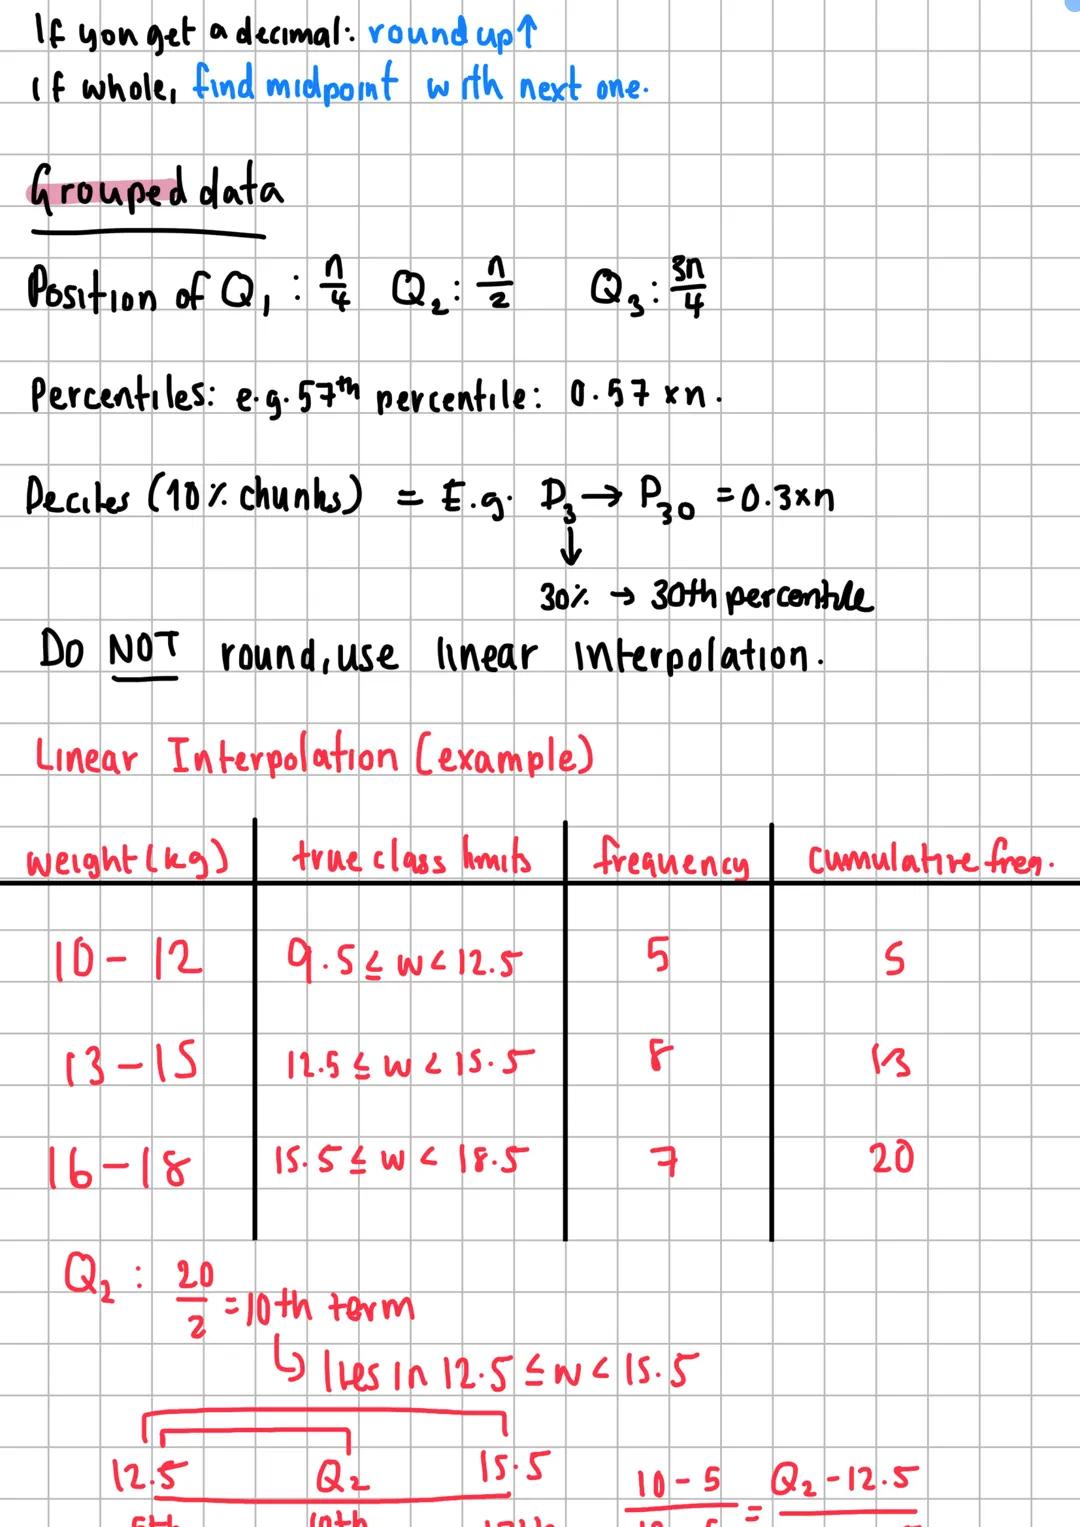
Measures of Location and Quartiles
Finding the mean is straightforward: add everything up and divide by how many values you have. For frequency tables, use Σfx ÷ Σf. But quartiles show you where your data splits into quarters, giving you a much better picture of the distribution.
Listed data quartiles are simple - Q₁ sits at position n/4, Q₂ (the median) at n/2, and Q₃ at 3n/4. If you get a decimal position, round up. If it's a whole number, find the midpoint with the next value.
Grouped data needs linear interpolation because your quartile position might fall somewhere within a class interval. Find which class contains your quartile position, then use the formula to work out exactly where it sits within that range.
Percentiles and deciles work similarly - the 57th percentile sits at 0.57 × n, whilst deciles split your data into 10% chunks. Never round these positions; always use linear interpolation for the most accurate results.
Key insight: Quartiles tell you more about your data's shape than the mean alone ever could - they show you whether values cluster together or spread out widely.
5
of 10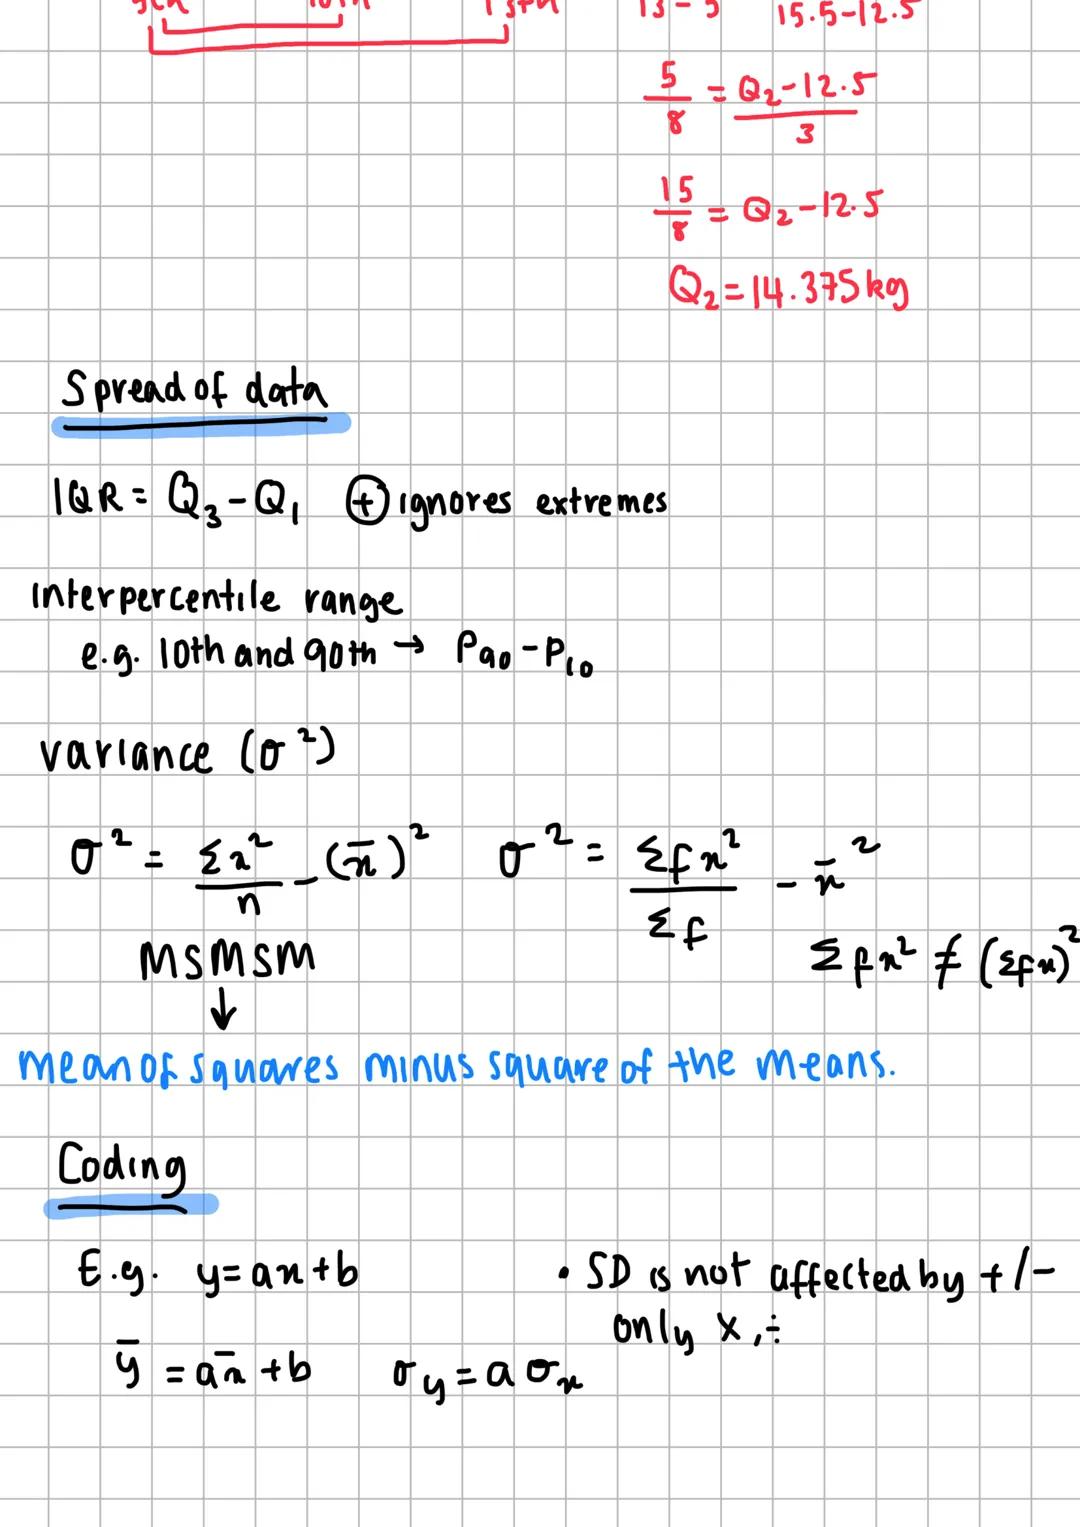
Spread and Variation in Data
The interquartile range (IQR) equals Q₃ - Q₁ and brilliantly ignores extreme values that might skew your results. Interpercentile ranges work the same way - P₉₀ - P₁₀ shows the spread whilst ignoring the most extreme 10% at each end.
Variance (σ²) measures how spread out your data is from the mean. Use the formula: Σx²/n - (x̄)². For frequency data, it's Σfx²/Σf - x̄². Remember, Σfx² is completely different from (Σfx)² - don't mix them up!
Coding makes calculations easier when dealing with awkward numbers. If y = ax + b, then the mean becomes ȳ = ax̄ + b. The standard deviation changes to σy = aσx. Notice that adding or subtracting values doesn't change the standard deviation - only multiplication or division affects spread.
Think "mean of squares minus square of the means" for variance. This helps you remember the correct order of operations and avoid common mistakes.
Pro tip: Standard deviation isn't affected by adding or subtracting the same value to all your data points - only scaling (multiplying) changes the spread.
6
of 10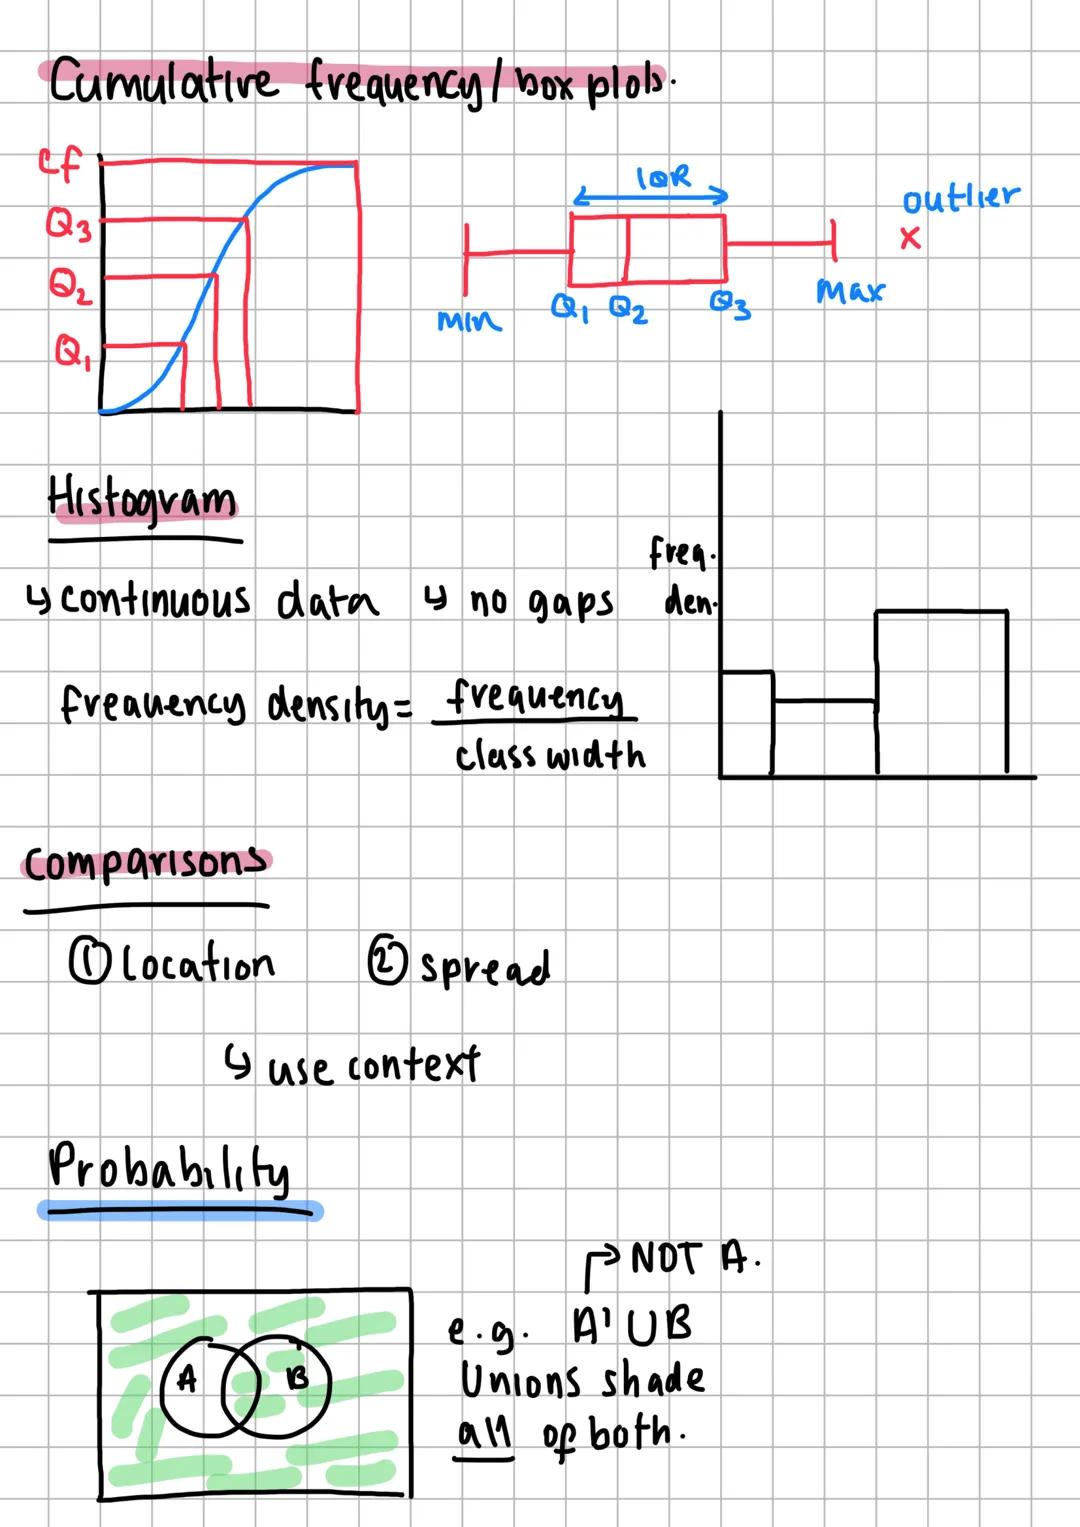
Visual Data Representation
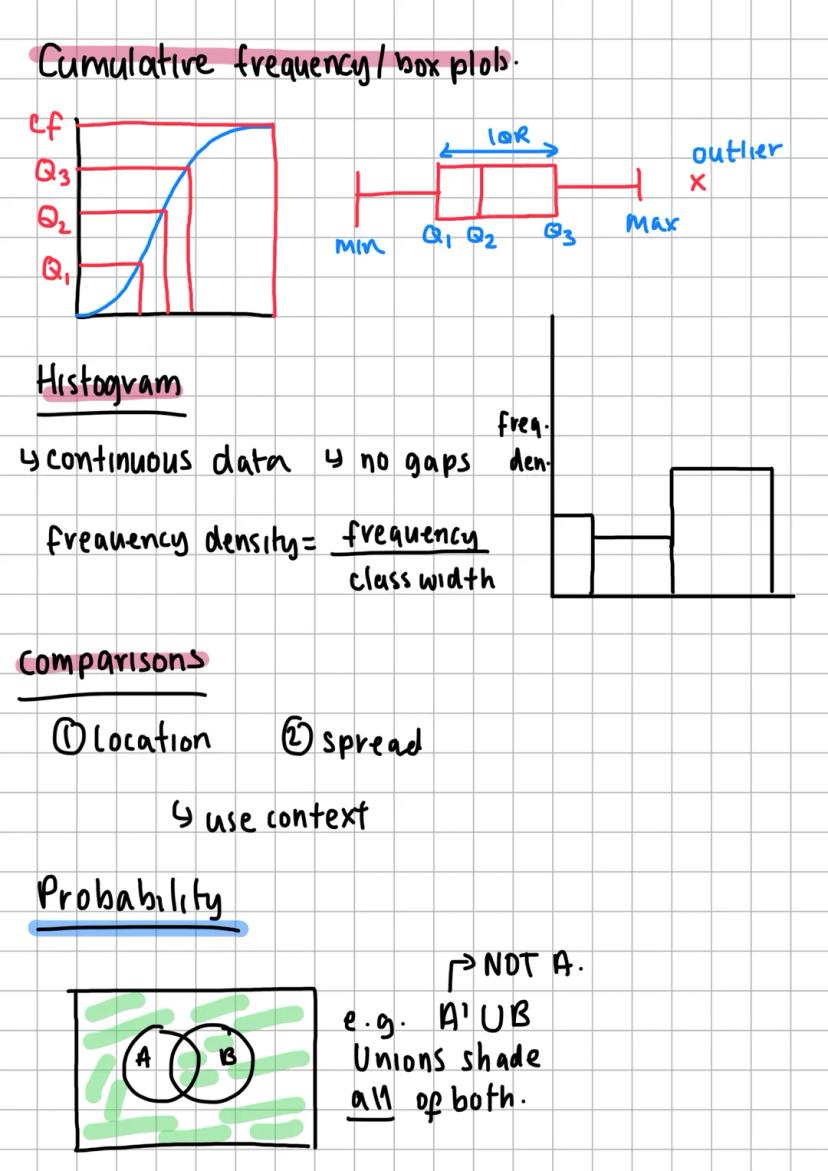
Cumulative frequency curves and box plots show your data's distribution at a glance. Box plots display the five-number summary (min, Q₁, Q₂, Q₃, max) and highlight outliers as individual points beyond the whiskers.
Histograms work for continuous data with no gaps between bars. The key is frequency density = frequency ÷ class width. This adjustment ensures areas represent frequencies correctly, even when class widths vary.
When comparing distributions, focus on three elements: location (where the centre sits), spread (how scattered the values are), and always use the context of your data. Don't just state that "Dataset A has a higher mean" - explain what this means for the real situation you're studying.
Statistical charts aren't just pretty pictures - they're powerful tools for spotting patterns, outliers, and trends that raw numbers might hide.
Visual learning: A well-drawn histogram or box plot can reveal patterns in seconds that might take ages to spot in a table of numbers.
7
of 10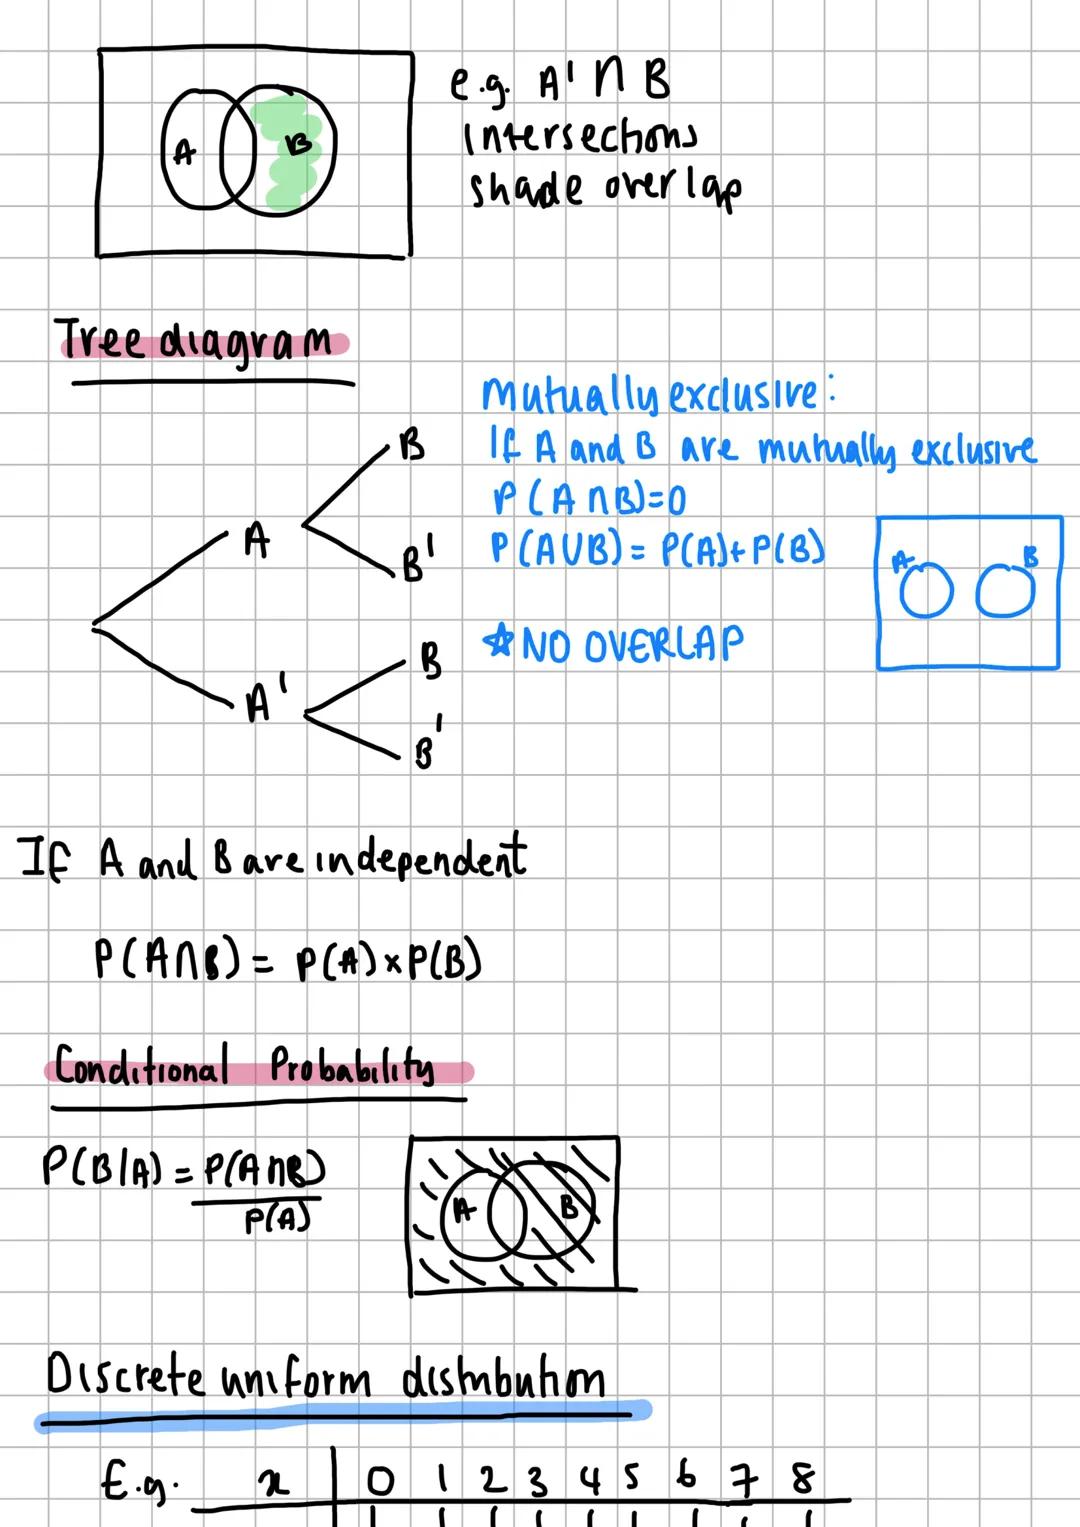
Probability Fundamentals
Probability measures how likely events are to happen, from 0 (impossible) to 1 (certain). Union (A ∪ B) means "A OR B happens" - shade both circles in a Venn diagram. Intersection (A ∩ B) means "both A AND B happen" - shade only the overlap.
Tree diagrams map out multiple events brilliantly. Each branch shows a probability, and you multiply along branches to find combined probabilities. For independent events, P(A ∩ B) = P(A) × P(B) - one event doesn't affect the other.
Conditional probability asks "what's the chance of B happening, given that A has already occurred?" Use P(B|A) = P(A ∩ B) ÷ P(A). This is massive in real life - like finding the probability of rain given it's cloudy.
Mutually exclusive events can't happen simultaneously - if A occurs, B definitely can't. So P(A ∩ B) = 0, and P(A ∪ B) = P(A) + P(B). Think of rolling a dice - you can't get both a 3 AND a 5 on the same roll.
Real-world connection: Conditional probability explains why medical tests aren't 100% reliable and why weather forecasts give percentage chances rather than definite predictions.
8
of 10
Binomial Distribution and Hypothesis Testing
Binomial distribution X~B(n,p) models situations with fixed trials, fixed probability, independence, and just two outcomes (success/failure). Use P = (n choose r) × p^r × ^ to find exact probabilities.
Cumulative probabilities need careful attention to inequalities. P(X≤4) includes 4, but P(X<5) also equals P(X≤4). For P(X≥3), calculate 1-P(X≤2). Always check whether your boundary values are included.
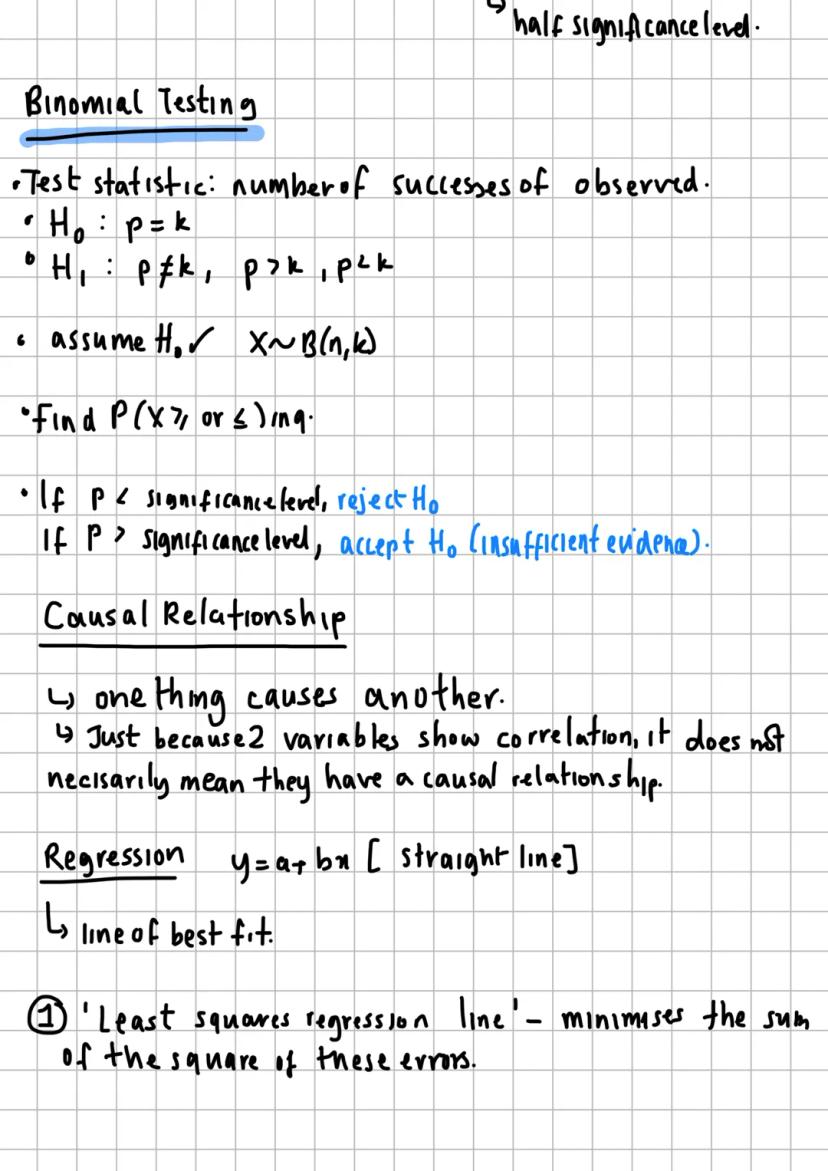
Hypothesis testing starts with the null hypothesis (H₀) - what you assume is true. The alternative hypothesis (H₁) is what you suspect might actually be happening. Your significance level sets the threshold for deciding whether to reject H₀.
One-tailed tests look for changes in a specific direction (H₁: p>k or p<k), whilst two-tailed tests just check for any difference (H₁: p≠k). For two-tailed tests, split your significance level in half.
Critical thinking: Hypothesis testing doesn't "prove" anything - it just tells you whether your evidence is strong enough to doubt what you initially assumed was true.
9
of 10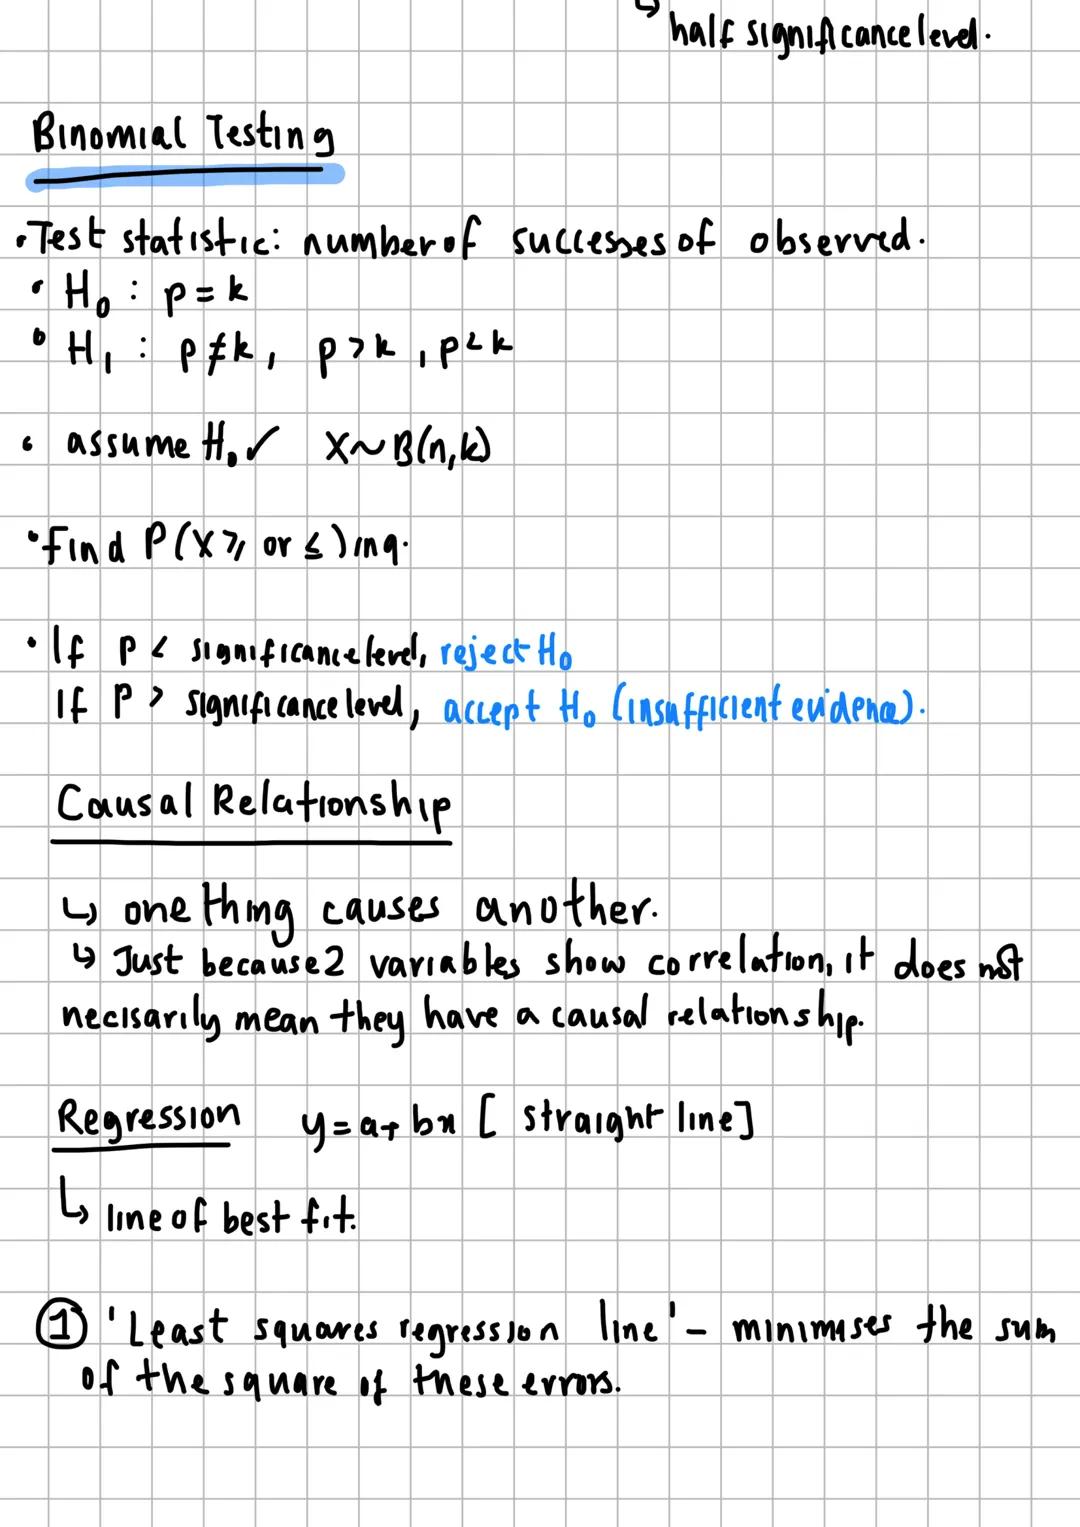
Statistical Testing and Correlation
Binomial hypothesis testing uses your observed number of successes as the test statistic. Assume H₀ is true, find P(X≥ or ≤ observed value), then compare with your significance level. If P < significance level, reject H₀. If P > significance level, there's insufficient evidence to reject H₀.
Correlation vs causation - just because two variables move together doesn't mean one causes the other. Ice cream sales and drowning incidents both increase in summer, but ice cream doesn't cause drowning. Always consider lurking variables that might explain apparent relationships.
Linear regression finds the line of best fit using y = a + bx. The least squares regression line minimises the sum of squared errors, giving you the most accurate predictions possible. The slope tells you how much y changes for each unit increase in x.
Understanding what your regression equation means in context is crucial. If y = 20 + 3x represents exam marks vs revision hours, then 20 is the expected mark with zero revision, and each hour of revision adds 3 marks on average.
Exam success: Always interpret your regression coefficients in the context of the problem - don't just state the numbers without explaining what they mean in real terms.
10
of 10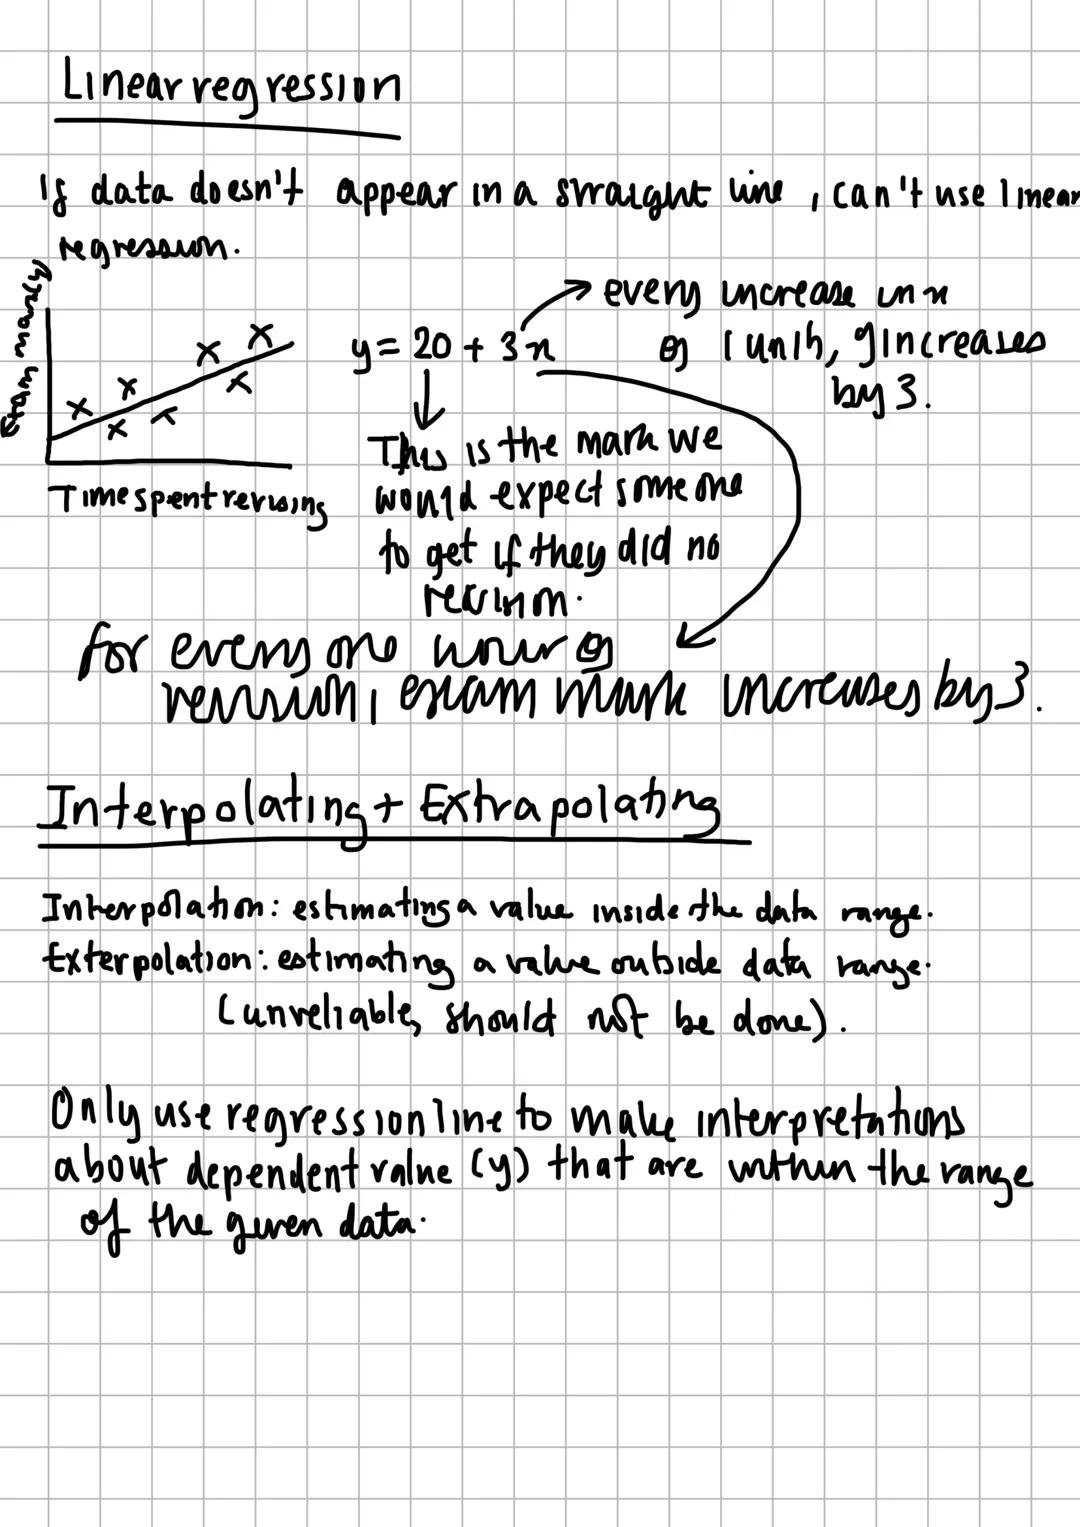
Linear Regression Applications
Linear regression only works when your data actually follows a straight-line pattern. If your scatter plot looks curved or random, linear regression will give misleading results. Always plot your data first to check this assumption.
Interpolation estimates values within your data range and is generally reliable. Extrapolation predicts values outside your data range but becomes increasingly unreliable the further you go. Avoid extrapolation in exams unless specifically asked.
Your regression line helps predict the dependent variable from the independent variable , but only use it within the range of your original data. Making predictions about exam marks for 50 hours of revision when your data only goes up to 20 hours is asking for trouble.
The regression equation tells a story about relationships. A positive slope means variables increase together, whilst a negative slope indicates that as one increases, the other decreases. The y-intercept shows the predicted y-value when x equals zero.
Practical wisdom: Regression lines are powerful prediction tools, but they're only as good as the data you feed them - garbage in, garbage out!
We thought you’d never ask...
Our AI Companion is a student-focused AI tool that offers more than just answers. Built on millions of Knowunity resources, it provides relevant information, personalised study plans, quizzes, and content directly in the chat, adapting to your individual learning journey.
You can download the app from Google Play Store and Apple App Store.
That's right! Enjoy free access to study content, connect with fellow students, and get instant help – all at your fingertips.
Similar content
Most popular content: Random Sampling
1Most popular content in Maths
9Comprehensive Maths Concepts
Explore essential mathematical concepts including powers, geometry, statistics, and probability. This resource features 65 pages of detailed explanations, diagrams, and examples to enhance your understanding of topics such as right triangles, volume calculations, and data representation. Ideal for students seeking to strengthen their numeracy skills and grasp complex mathematical principles.
1080,0876,321
GCSE Maths (Higher) // Revision Guide
The only GCSE maths (higher) revision guide you need to get a grade 9! Contains every topic, each with all potential question types and their solutions.
102,59960
M
Medium Level alerbra
Master challenging maths concepts with this medium level flashcard set designed for grade 7/8 students. Strengthen your problem-solving skills and boost your confidence in maths!
78763
M
Mastering Maths: Essential Concepts for Grade 10
Boost your math skills with this comprehensive flashcard set covering key concepts for grade 10. Perfect for exam preparation and building a strong foundation in mathematics.
105521
M
Mastering Medium-Level Maths: Essential Flashcards for Grade 11 Students
Boost your Maths skills with this comprehensive set of flashcards designed specifically for Grade 11 students. Covering medium-level topics, these cards will help you ace your exams and build a solid foundation for advanced Maths.
119623
Comprehensive Maths Concepts
Explore essential mathematical concepts including polynomial theorems, logarithmic properties, trigonometric functions, and integration techniques. This resource covers everything from solving inequalities to understanding exponential functions, providing a solid foundation for A-level mathematics. Ideal for students aiming for top grades.
1222,0231,817
M
Maths Made Easy: Essential Concepts for Grade 7
Master key mathematical concepts with this comprehensive flashcard set designed specifically for 13-year-old students. Strengthen your understanding and ace your exams!
77842
P
Percentage,fractions and decimals
how well do you know percentages,fractions and decimals
73193
M
maths SOHCAHTOA
Trigonometric ratios SOHCAHTOA for calculating angles and sides in right-angled triangles.
112230
Most popular content
9Sociology of Education Overview
Explore comprehensive A-Level Sociology notes on the education system, covering key theories, policies, and sociological perspectives. This resource includes insights on marketisation, gender roles, cultural deprivation, and educational inequalities, providing a thorough understanding of how education shapes social stratification and individual achievement. Ideal for exam preparation and in-depth study.
12102,9193,041
Sociology of Families: Comprehensive Revision
Dive into an extensive overview of family dynamics, perspectives, and patterns in sociology. This resource covers key concepts such as family diversity, gender roles, marriage, and the impact of social policies on family structures. Perfect for A-Level Sociology students preparing for Paper 2.
1273,7092,307
Criminology: Crime & Punishment Overview
Comprehensive mindmaps covering key concepts in the Crime and Punishment topic for WJEC Criminology Unit 4. This resource includes detailed insights into the Criminal Justice System, crime prevention strategies, sentencing models, and the roles of various agencies. Ideal for A-Level revision, ensuring you grasp essential theories and legislative processes to excel in your exams.
1254,8851,059
Comprehensive Crime & Deviance Overview
Explore an extensive revision of crime and deviance topics, including theories, types of crime, and the impact of media. This resource covers key concepts such as Marxism, functionalism, gender and crime, and the influence of globalization on criminal behavior. Ideal for students seeking a thorough understanding of criminology and its various theories. Type: Full Topic Revision.
1251,6641,400
C
Cell Biology and Cell structure
cell structures
93,2620
WJEC Unit 4 Criminology
Criminology unit 4 detailed revision note
127,167125
An Inspector Calls: Character Insights
Explore in-depth analysis and key quotes for characters in J.B. Priestley's 'An Inspector Calls'. This resource covers Gerald Croft, Inspector Goole, Sheila Birling, Mrs. Birling, Eric Birling, and Eva Smith, focusing on themes of class, gender roles, and social responsibility. Ideal for students aiming for Grade 8 and above.
1025,437907
Criminology Theories Overview
Explore key criminology theories and their implications on crime and deviance. This comprehensive summary covers biological, psychological, and sociological perspectives, including labelling theory, right realism, and the impact of social campaigns on policy development. Ideal for A-Level criminology students seeking to understand the complexities of criminal behaviour and the factors influencing crime prevention strategies.
129,768210
Sociological Theories Overview
Comprehensive revision of key sociological theories including Functionalism, Marxism, Feminism, and Interpretivism. Explore concepts like value freedom, identity formation, and the critique of social control. Ideal for AQA A-Level Sociology students preparing for exams. This summary covers essential theories and their implications in sociology, providing a clear understanding of each perspective.
1231,468846
Students love us — and so will you.
4.6/5App Store
4.7/5Google Play
The app is very easy to use and well designed. I have found everything I was looking for so far and have been able to learn a lot from the presentations! I will definitely use the app for a class assignment! And of course it also helps a lot as an inspiration.
Stefan SiOS user
This app is really great. There are so many study notes and help [...]. My problem subject is French, for example, and the app has so many options for help. Thanks to this app, I have improved my French. I would recommend it to anyone.
Samantha KlichAndroid user
Wow, I am really amazed. I just tried the app because I've seen it advertised many times and was absolutely stunned. This app is THE HELP you want for school and above all, it offers so many things, such as workouts and fact sheets, which have been VERY helpful to me personally.
AnnaiOS user
AS Level Statistics Notes - Edexcel Year 1
A
a🖤@inactive_ax
Statistics is everywhere - from predicting exam results to understanding data patterns that affect your daily life. This guide covers the essential statistical concepts you'll need for Year 1 maths, from collecting reliable data to making sense of probability and...
1
of 10
Sign up to see the content. It's free!
- Access to all documents
- Improve your grades
- Join milions of students
By signing up you accept Terms of Service and Privacy Policy
Getting Started with Statistics
Statistics helps you make sense of the world around you by collecting and analysing data. Whether you're looking at exam results, social media trends, or scientific research, the methods you'll learn here are the foundation for understanding what the numbers actually mean.
The key is knowing how to collect good data and then interpret it properly. You'll discover different ways to gather information, measure what matters, and spot patterns that can help predict future outcomes.
2
of 10Sign up to see the content. It's free!
- Access to all documents
- Improve your grades
- Join milions of students
By signing up you accept Terms of Service and Privacy Policy
Data Collection Methods
Census vs sampling - that's your first big choice when collecting data. A census measures every single person in your population (like the UK national census), giving you perfect accuracy but costing loads of time and money.
Sampling is much more practical for most situations. You'll use a sampling frame (your list of potential participants) to select sampling units (the actual people you'll survey). Simple random sampling gives everyone an equal chance using a random number generator - it's completely unbiased but you need that complete list first.
Systematic sampling is brilliant when you want speed. Calculate k = population size ÷ sample size, pick a random starting point, then take every kth person. Stratified sampling ensures your sample represents different groups proportionally - work out (sample ÷ population) × group size, then randomly select within each group.
Quick tip: Random sampling methods eliminate bias but need complete lists, whilst non-random methods like quota and opportunity sampling are cheaper but potentially biased.
3
of 10Sign up to see the content. It's free!
- Access to all documents
- Improve your grades
- Join milions of students
By signing up you accept Terms of Service and Privacy Policy
Non-Random Sampling and Data Types
Quota sampling works like stratified sampling, but researchers fill each group however they want - no random selection needed. It's dead easy since you don't need a complete sampling frame, but bias can creep in. Opportunity sampling just grabs whoever's available at the time - think surveying people outside Tesco. Super cheap and quick, but hardly representative of the whole population.
Data types matter loads for your analysis. Qualitative data describes qualities (like favourite colours or opinions), whilst quantitative data deals with actual numbers. Quantitative splits into discrete (whole numbers like number of siblings) and continuous (measurements like height that can be any value).
Understanding these differences helps you choose the right analysis methods later on. You can't calculate an average of favourite pizza toppings, but you absolutely can find the mean number of pets people own.
Remember: The sampling method you choose affects how trustworthy your results will be, so pick wisely based on your time, budget, and accuracy needs.
4
of 10Sign up to see the content. It's free!
- Access to all documents
- Improve your grades
- Join milions of students
By signing up you accept Terms of Service and Privacy Policy
Measures of Location and Quartiles
Finding the mean is straightforward: add everything up and divide by how many values you have. For frequency tables, use Σfx ÷ Σf. But quartiles show you where your data splits into quarters, giving you a much better picture of the distribution.
Listed data quartiles are simple - Q₁ sits at position n/4, Q₂ (the median) at n/2, and Q₃ at 3n/4. If you get a decimal position, round up. If it's a whole number, find the midpoint with the next value.
Grouped data needs linear interpolation because your quartile position might fall somewhere within a class interval. Find which class contains your quartile position, then use the formula to work out exactly where it sits within that range.
Percentiles and deciles work similarly - the 57th percentile sits at 0.57 × n, whilst deciles split your data into 10% chunks. Never round these positions; always use linear interpolation for the most accurate results.
Key insight: Quartiles tell you more about your data's shape than the mean alone ever could - they show you whether values cluster together or spread out widely.
5
of 10Sign up to see the content. It's free!
- Access to all documents
- Improve your grades
- Join milions of students
By signing up you accept Terms of Service and Privacy Policy
Spread and Variation in Data
The interquartile range (IQR) equals Q₃ - Q₁ and brilliantly ignores extreme values that might skew your results. Interpercentile ranges work the same way - P₉₀ - P₁₀ shows the spread whilst ignoring the most extreme 10% at each end.
Variance (σ²) measures how spread out your data is from the mean. Use the formula: Σx²/n - (x̄)². For frequency data, it's Σfx²/Σf - x̄². Remember, Σfx² is completely different from (Σfx)² - don't mix them up!
Coding makes calculations easier when dealing with awkward numbers. If y = ax + b, then the mean becomes ȳ = ax̄ + b. The standard deviation changes to σy = aσx. Notice that adding or subtracting values doesn't change the standard deviation - only multiplication or division affects spread.
Think "mean of squares minus square of the means" for variance. This helps you remember the correct order of operations and avoid common mistakes.
Pro tip: Standard deviation isn't affected by adding or subtracting the same value to all your data points - only scaling (multiplying) changes the spread.
6
of 10Sign up to see the content. It's free!
- Access to all documents
- Improve your grades
- Join milions of students
By signing up you accept Terms of Service and Privacy Policy
Visual Data Representation
Cumulative frequency curves and box plots show your data's distribution at a glance. Box plots display the five-number summary (min, Q₁, Q₂, Q₃, max) and highlight outliers as individual points beyond the whiskers.
Histograms work for continuous data with no gaps between bars. The key is frequency density = frequency ÷ class width. This adjustment ensures areas represent frequencies correctly, even when class widths vary.
When comparing distributions, focus on three elements: location (where the centre sits), spread (how scattered the values are), and always use the context of your data. Don't just state that "Dataset A has a higher mean" - explain what this means for the real situation you're studying.
Statistical charts aren't just pretty pictures - they're powerful tools for spotting patterns, outliers, and trends that raw numbers might hide.
Visual learning: A well-drawn histogram or box plot can reveal patterns in seconds that might take ages to spot in a table of numbers.
7
of 10Sign up to see the content. It's free!
- Access to all documents
- Improve your grades
- Join milions of students
By signing up you accept Terms of Service and Privacy Policy
Probability Fundamentals
Probability measures how likely events are to happen, from 0 (impossible) to 1 (certain). Union (A ∪ B) means "A OR B happens" - shade both circles in a Venn diagram. Intersection (A ∩ B) means "both A AND B happen" - shade only the overlap.
Tree diagrams map out multiple events brilliantly. Each branch shows a probability, and you multiply along branches to find combined probabilities. For independent events, P(A ∩ B) = P(A) × P(B) - one event doesn't affect the other.
Conditional probability asks "what's the chance of B happening, given that A has already occurred?" Use P(B|A) = P(A ∩ B) ÷ P(A). This is massive in real life - like finding the probability of rain given it's cloudy.
Mutually exclusive events can't happen simultaneously - if A occurs, B definitely can't. So P(A ∩ B) = 0, and P(A ∪ B) = P(A) + P(B). Think of rolling a dice - you can't get both a 3 AND a 5 on the same roll.
Real-world connection: Conditional probability explains why medical tests aren't 100% reliable and why weather forecasts give percentage chances rather than definite predictions.
8
of 10Sign up to see the content. It's free!
- Access to all documents
- Improve your grades
- Join milions of students
By signing up you accept Terms of Service and Privacy Policy
Binomial Distribution and Hypothesis Testing
Binomial distribution X~B(n,p) models situations with fixed trials, fixed probability, independence, and just two outcomes (success/failure). Use P = (n choose r) × p^r × ^ to find exact probabilities.
Cumulative probabilities need careful attention to inequalities. P(X≤4) includes 4, but P(X<5) also equals P(X≤4). For P(X≥3), calculate 1-P(X≤2). Always check whether your boundary values are included.
Hypothesis testing starts with the null hypothesis (H₀) - what you assume is true. The alternative hypothesis (H₁) is what you suspect might actually be happening. Your significance level sets the threshold for deciding whether to reject H₀.
One-tailed tests look for changes in a specific direction (H₁: p>k or p<k), whilst two-tailed tests just check for any difference (H₁: p≠k). For two-tailed tests, split your significance level in half.
Critical thinking: Hypothesis testing doesn't "prove" anything - it just tells you whether your evidence is strong enough to doubt what you initially assumed was true.
9
of 10Sign up to see the content. It's free!
- Access to all documents
- Improve your grades
- Join milions of students
By signing up you accept Terms of Service and Privacy Policy
Statistical Testing and Correlation
Binomial hypothesis testing uses your observed number of successes as the test statistic. Assume H₀ is true, find P(X≥ or ≤ observed value), then compare with your significance level. If P < significance level, reject H₀. If P > significance level, there's insufficient evidence to reject H₀.
Correlation vs causation - just because two variables move together doesn't mean one causes the other. Ice cream sales and drowning incidents both increase in summer, but ice cream doesn't cause drowning. Always consider lurking variables that might explain apparent relationships.
Linear regression finds the line of best fit using y = a + bx. The least squares regression line minimises the sum of squared errors, giving you the most accurate predictions possible. The slope tells you how much y changes for each unit increase in x.
Understanding what your regression equation means in context is crucial. If y = 20 + 3x represents exam marks vs revision hours, then 20 is the expected mark with zero revision, and each hour of revision adds 3 marks on average.
Exam success: Always interpret your regression coefficients in the context of the problem - don't just state the numbers without explaining what they mean in real terms.
10
of 10Sign up to see the content. It's free!
- Access to all documents
- Improve your grades
- Join milions of students
By signing up you accept Terms of Service and Privacy Policy
Linear Regression Applications
Linear regression only works when your data actually follows a straight-line pattern. If your scatter plot looks curved or random, linear regression will give misleading results. Always plot your data first to check this assumption.
Interpolation estimates values within your data range and is generally reliable. Extrapolation predicts values outside your data range but becomes increasingly unreliable the further you go. Avoid extrapolation in exams unless specifically asked.
Your regression line helps predict the dependent variable from the independent variable , but only use it within the range of your original data. Making predictions about exam marks for 50 hours of revision when your data only goes up to 20 hours is asking for trouble.
The regression equation tells a story about relationships. A positive slope means variables increase together, whilst a negative slope indicates that as one increases, the other decreases. The y-intercept shows the predicted y-value when x equals zero.
Practical wisdom: Regression lines are powerful prediction tools, but they're only as good as the data you feed them - garbage in, garbage out!
We thought you’d never ask...
Our AI Companion is a student-focused AI tool that offers more than just answers. Built on millions of Knowunity resources, it provides relevant information, personalised study plans, quizzes, and content directly in the chat, adapting to your individual learning journey.
You can download the app from Google Play Store and Apple App Store.
That's right! Enjoy free access to study content, connect with fellow students, and get instant help – all at your fingertips.
Similar content
Most popular content: Random Sampling
1Most popular content in Maths
9Comprehensive Maths Concepts
Explore essential mathematical concepts including powers, geometry, statistics, and probability. This resource features 65 pages of detailed explanations, diagrams, and examples to enhance your understanding of topics such as right triangles, volume calculations, and data representation. Ideal for students seeking to strengthen their numeracy skills and grasp complex mathematical principles.
1080,0876,321
GCSE Maths (Higher) // Revision Guide
The only GCSE maths (higher) revision guide you need to get a grade 9! Contains every topic, each with all potential question types and their solutions.
102,59960
M
Medium Level alerbra
Master challenging maths concepts with this medium level flashcard set designed for grade 7/8 students. Strengthen your problem-solving skills and boost your confidence in maths!
78763
M
Mastering Maths: Essential Concepts for Grade 10
Boost your math skills with this comprehensive flashcard set covering key concepts for grade 10. Perfect for exam preparation and building a strong foundation in mathematics.
105521
M
Mastering Medium-Level Maths: Essential Flashcards for Grade 11 Students
Boost your Maths skills with this comprehensive set of flashcards designed specifically for Grade 11 students. Covering medium-level topics, these cards will help you ace your exams and build a solid foundation for advanced Maths.
119623
Comprehensive Maths Concepts
Explore essential mathematical concepts including polynomial theorems, logarithmic properties, trigonometric functions, and integration techniques. This resource covers everything from solving inequalities to understanding exponential functions, providing a solid foundation for A-level mathematics. Ideal for students aiming for top grades.
1222,0231,817
M
Maths Made Easy: Essential Concepts for Grade 7
Master key mathematical concepts with this comprehensive flashcard set designed specifically for 13-year-old students. Strengthen your understanding and ace your exams!
77842
P
Percentage,fractions and decimals
how well do you know percentages,fractions and decimals
73193
M
maths SOHCAHTOA
Trigonometric ratios SOHCAHTOA for calculating angles and sides in right-angled triangles.
112230
Most popular content
9Sociology of Education Overview
Explore comprehensive A-Level Sociology notes on the education system, covering key theories, policies, and sociological perspectives. This resource includes insights on marketisation, gender roles, cultural deprivation, and educational inequalities, providing a thorough understanding of how education shapes social stratification and individual achievement. Ideal for exam preparation and in-depth study.
12102,9193,041
Sociology of Families: Comprehensive Revision
Dive into an extensive overview of family dynamics, perspectives, and patterns in sociology. This resource covers key concepts such as family diversity, gender roles, marriage, and the impact of social policies on family structures. Perfect for A-Level Sociology students preparing for Paper 2.
1273,7092,307
Criminology: Crime & Punishment Overview
Comprehensive mindmaps covering key concepts in the Crime and Punishment topic for WJEC Criminology Unit 4. This resource includes detailed insights into the Criminal Justice System, crime prevention strategies, sentencing models, and the roles of various agencies. Ideal for A-Level revision, ensuring you grasp essential theories and legislative processes to excel in your exams.
1254,8851,059
Comprehensive Crime & Deviance Overview
Explore an extensive revision of crime and deviance topics, including theories, types of crime, and the impact of media. This resource covers key concepts such as Marxism, functionalism, gender and crime, and the influence of globalization on criminal behavior. Ideal for students seeking a thorough understanding of criminology and its various theories. Type: Full Topic Revision.
1251,6641,400
C
Cell Biology and Cell structure
cell structures
93,2620
WJEC Unit 4 Criminology
Criminology unit 4 detailed revision note
127,167125
An Inspector Calls: Character Insights
Explore in-depth analysis and key quotes for characters in J.B. Priestley's 'An Inspector Calls'. This resource covers Gerald Croft, Inspector Goole, Sheila Birling, Mrs. Birling, Eric Birling, and Eva Smith, focusing on themes of class, gender roles, and social responsibility. Ideal for students aiming for Grade 8 and above.
1025,437907
Criminology Theories Overview
Explore key criminology theories and their implications on crime and deviance. This comprehensive summary covers biological, psychological, and sociological perspectives, including labelling theory, right realism, and the impact of social campaigns on policy development. Ideal for A-Level criminology students seeking to understand the complexities of criminal behaviour and the factors influencing crime prevention strategies.
129,768210
Sociological Theories Overview
Comprehensive revision of key sociological theories including Functionalism, Marxism, Feminism, and Interpretivism. Explore concepts like value freedom, identity formation, and the critique of social control. Ideal for AQA A-Level Sociology students preparing for exams. This summary covers essential theories and their implications in sociology, providing a clear understanding of each perspective.
1231,468846
Students love us — and so will you.
4.6/5App Store
4.7/5Google Play
The app is very easy to use and well designed. I have found everything I was looking for so far and have been able to learn a lot from the presentations! I will definitely use the app for a class assignment! And of course it also helps a lot as an inspiration.
Stefan SiOS user
This app is really great. There are so many study notes and help [...]. My problem subject is French, for example, and the app has so many options for help. Thanks to this app, I have improved my French. I would recommend it to anyone.
Samantha KlichAndroid user
Wow, I am really amazed. I just tried the app because I've seen it advertised many times and was absolutely stunned. This app is THE HELP you want for school and above all, it offers so many things, such as workouts and fact sheets, which have been VERY helpful to me personally.
AnnaiOS user