The development gap explores why some countries are incredibly wealthy...
Understanding the Development Gap for GCSE Geography
1
of 1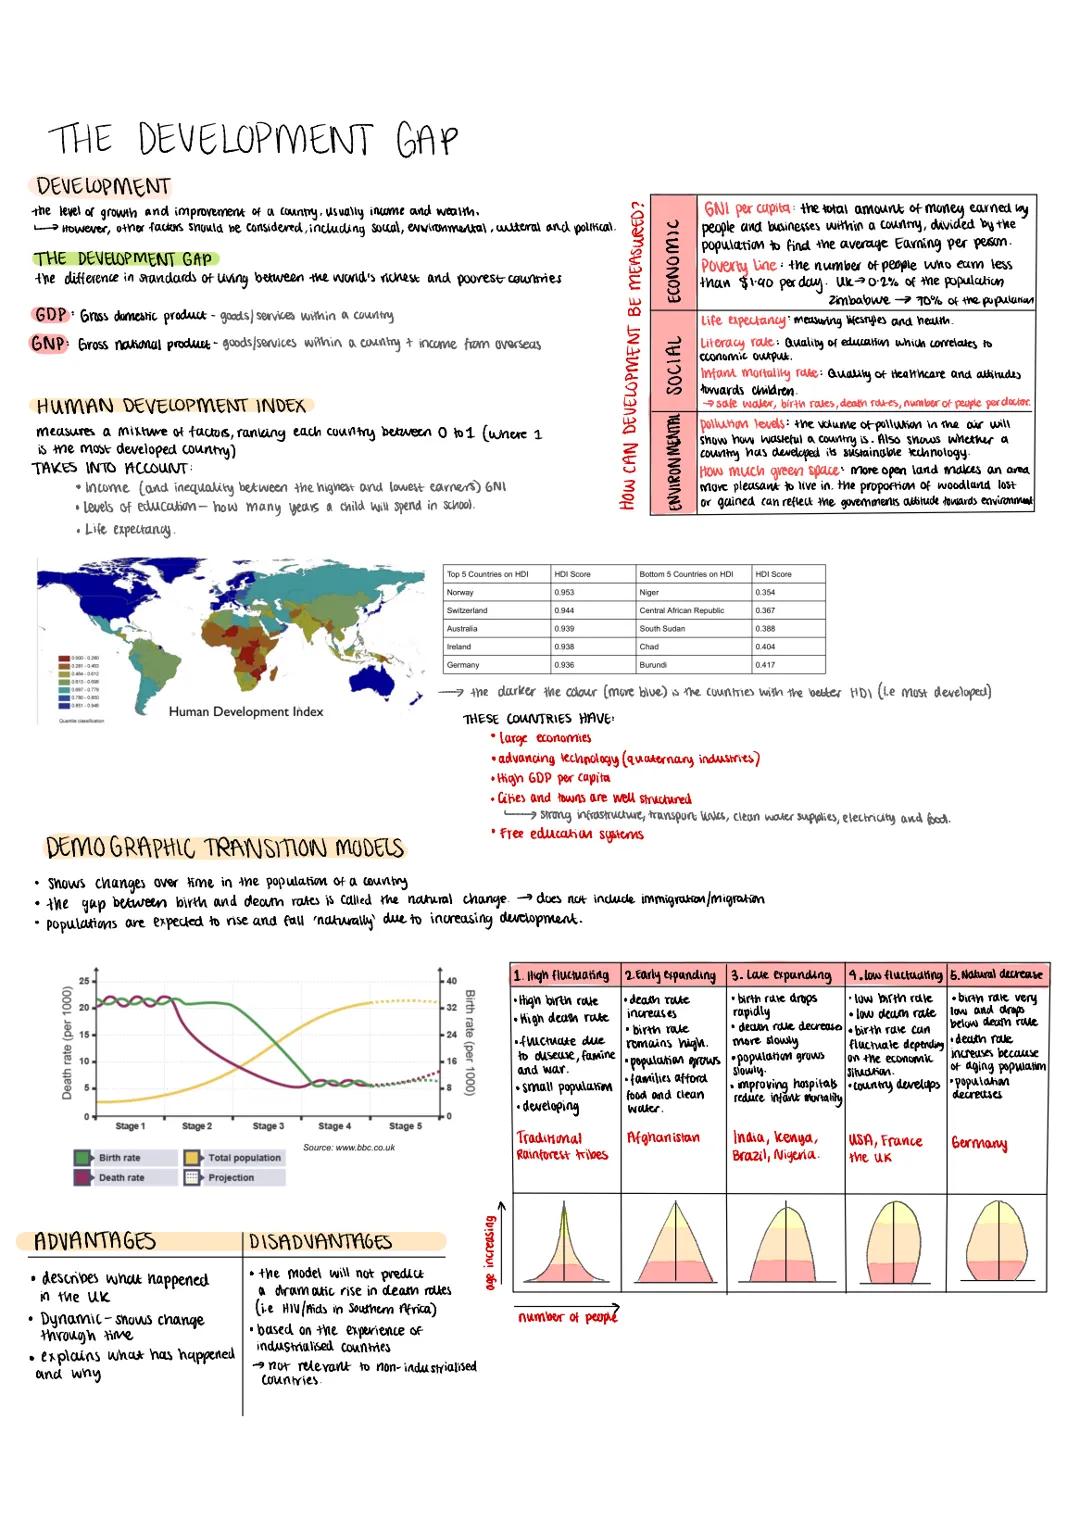
Understanding Development and Global Inequalities
Ever wondered why life in Norway feels worlds apart from life in Niger? Development measures how much a country has grown and improved, looking beyond just money to include social, environmental, and political factors too.
The development gap represents the massive difference in living standards between the world's richest and poorest nations. It's like comparing a luxury mansion to a basic shelter - both provide homes, but the quality of life differs enormously.
We measure development using several key indicators. GDP (Gross Domestic Product) tracks goods and services within a country, while GNP includes overseas income too. The Human Development Index (HDI) ranks countries from 0 to 1, considering income inequality, education years, and life expectancy.
Quick Fact: Norway tops the HDI at 0.953, whilst Niger sits at just 0.354 - highlighting the stark development gap.
Other crucial measurements include GNI per capita (average earnings per person), poverty lines (people earning under $1.90 daily), life expectancy, literacy rates, and environmental factors like pollution levels. These paint a complete picture of how developed a country really is.
The most developed countries share common features: large economies, advanced technology, strong infrastructure, free education systems, and well-structured cities with reliable electricity, clean water, and transport links.
Population Changes and the Demographic Transition Model
Population patterns aren't random - they follow predictable stages as countries develop. The Demographic Transition Model shows how birth rates, death rates, and total population change over time through five distinct stages.
Stage 1 (High Fluctuating) sees high birth and death rates, so population grows slowly. Stage 2 (Early Expanding) brings falling death rates whilst birth rates remain high, causing rapid population growth as families can afford better food, water, and healthcare.
Stage 3 (Late Expanding) shows birth rates dropping rapidly whilst death rates continue falling more slowly. Stage 4 (Low Fluctuating) reaches low birth and death rates, with birth rates fluctuating based on economic conditions.
Real-World Connection: The UK followed this exact pattern during industrialisation, which is why the model describes what actually happened there.
Stage 5 (Natural Decrease) sees birth rates fall below death rates due to ageing populations, causing natural population decline. However, the model has limitations - it can't predict sudden changes like HIV/AIDS impacts in Southern Africa, and it's based on industrialised countries' experiences, making it less relevant for non-industrialised nations.
We thought you’d never ask...
What is the Knowunity AI companion?
Our AI Companion is a student-focused AI tool that offers more than just answers. Built on millions of Knowunity resources, it provides relevant information, personalised study plans, quizzes, and content directly in the chat, adapting to your individual learning journey.
Where can I download the Knowunity app?
You can download the app from Google Play Store and Apple App Store.
Is Knowunity really free of charge?
That's right! Enjoy free access to study content, connect with fellow students, and get instant help – all at your fingertips.
Most popular content: Demographic Transition Model
1Most popular content in Geography
9U
Urbanisation - AQA GCSE Geography
Some questions on key knowledge from the Urbanisation topic in GCSE Geography
97950
T
topic one- hazards flashcards set 1
Explore the fascinating world of geography with these flashcards covering diverse topics like continents, landmarks, and natural wonders. Enhance your knowledge and ace your exams!
114660
AQA GCSE Geography Paper 1 revision notes (excl. case studies)
Revision notes for the AQA GCSE Geography specification. Does not include case studies as they are selected by the school.
93,76986
Geography Hazards & Landscapes
Explore key concepts in AQA Geography, covering rivers, coasts, natural hazards, and ecosystems. This summary highlights essential topics such as river processes, coastal management, desertification, and case studies on earthquakes and tropical storms. Ideal for exam preparation and understanding geographical systems.
103,063117
I
Introduction to Natural Hazard Types
Identify the differences between geological and meteorological hazards and understand the factors affecting hazard risk.
S32830
E
Exploring Natural Hazards: Causes and Effects
Discover the primary causes and common effects of natural hazards such as tsunamis, volcanic eruptions, hurricanes, wildfires, droughts, landslides, and more!
113110
P
Paper 1? Down what else
Explore the fascinating world of geography with these flashcards covering diverse topics like continents, landmarks, and natural wonders. Enhance your knowledge and ace your exams!
114692
Rio de Janeiro case study
AQA geography gcse
1094126
OCR B Geography Case Studies
Comprehensive revision notes covering key OCR B Geography case studies, including topics on climate change, urbanization, food security, and natural hazards. This resource is designed to aid students in understanding geographical concepts and preparing for exams effectively. Key case studies include Typhoon Haiyan, urban growth in Rio, and sustainable development practices in Tanzania.
102,00337
Most popular content
9Sociology of Education Overview
Explore comprehensive A-Level Sociology notes on the education system, covering key theories, policies, and sociological perspectives. This resource includes insights on marketisation, gender roles, cultural deprivation, and educational inequalities, providing a thorough understanding of how education shapes social stratification and individual achievement. Ideal for exam preparation and in-depth study.
12102,8093,040
Sociology of Families: Comprehensive Revision
Dive into an extensive overview of family dynamics, perspectives, and patterns in sociology. This resource covers key concepts such as family diversity, gender roles, marriage, and the impact of social policies on family structures. Perfect for A-Level Sociology students preparing for Paper 2.
1273,5592,306
Criminology: Crime & Punishment Overview
Comprehensive mindmaps covering key concepts in the Crime and Punishment topic for WJEC Criminology Unit 4. This resource includes detailed insights into the Criminal Justice System, crime prevention strategies, sentencing models, and the roles of various agencies. Ideal for A-Level revision, ensuring you grasp essential theories and legislative processes to excel in your exams.
1254,8531,059
Comprehensive Crime & Deviance Overview
Explore an extensive revision of crime and deviance topics, including theories, types of crime, and the impact of media. This resource covers key concepts such as Marxism, functionalism, gender and crime, and the influence of globalization on criminal behavior. Ideal for students seeking a thorough understanding of criminology and its various theories. Type: Full Topic Revision.
1251,6321,399
An Inspector Calls: Character Insights
Explore in-depth analysis and key quotes for characters in J.B. Priestley's 'An Inspector Calls'. This resource covers Gerald Croft, Inspector Goole, Sheila Birling, Mrs. Birling, Eric Birling, and Eva Smith, focusing on themes of class, gender roles, and social responsibility. Ideal for students aiming for Grade 8 and above.
1025,412907
WJEC Unit 4 Criminology
Criminology unit 4 detailed revision note
127,146125
C
Cell Biology and Cell structure
cell structures
93,1870
Criminology Theories Overview
Explore key criminology theories and their implications on crime and deviance. This comprehensive summary covers biological, psychological, and sociological perspectives, including labelling theory, right realism, and the impact of social campaigns on policy development. Ideal for A-Level criminology students seeking to understand the complexities of criminal behaviour and the factors influencing crime prevention strategies.
129,754210
Romeo and Juliet: Key themes
Key Romeo and Juliet themes and analysed quotes
106,695198
Can't find what you're looking for? Explore other subjects.
Students love us — and so will you.
4.6/5App Store
4.7/5Google Play
The app is very easy to use and well designed. I have found everything I was looking for so far and have been able to learn a lot from the presentations! I will definitely use the app for a class assignment! And of course it also helps a lot as an inspiration.
Stefan SiOS user
This app is really great. There are so many study notes and help [...]. My problem subject is French, for example, and the app has so many options for help. Thanks to this app, I have improved my French. I would recommend it to anyone.
Samantha KlichAndroid user
Wow, I am really amazed. I just tried the app because I've seen it advertised many times and was absolutely stunned. This app is THE HELP you want for school and above all, it offers so many things, such as workouts and fact sheets, which have been VERY helpful to me personally.
AnnaiOS user
Understanding the Development Gap for GCSE Geography
The development gap explores why some countries are incredibly wealthy whilst others struggle with extreme poverty. Understanding how we measure development and predict population changes is crucial for grasping global inequalities and their impacts on billions of people worldwide.
1
of 1
Sign up to see the content. It's free!
- Access to all documents
- Improve your grades
- Join milions of students
Understanding Development and Global Inequalities
Ever wondered why life in Norway feels worlds apart from life in Niger? Development measures how much a country has grown and improved, looking beyond just money to include social, environmental, and political factors too.
The development gap represents the massive difference in living standards between the world's richest and poorest nations. It's like comparing a luxury mansion to a basic shelter - both provide homes, but the quality of life differs enormously.
We measure development using several key indicators. GDP (Gross Domestic Product) tracks goods and services within a country, while GNP includes overseas income too. The Human Development Index (HDI) ranks countries from 0 to 1, considering income inequality, education years, and life expectancy.
Quick Fact: Norway tops the HDI at 0.953, whilst Niger sits at just 0.354 - highlighting the stark development gap.
Other crucial measurements include GNI per capita (average earnings per person), poverty lines (people earning under $1.90 daily), life expectancy, literacy rates, and environmental factors like pollution levels. These paint a complete picture of how developed a country really is.
The most developed countries share common features: large economies, advanced technology, strong infrastructure, free education systems, and well-structured cities with reliable electricity, clean water, and transport links.
Population Changes and the Demographic Transition Model
Population patterns aren't random - they follow predictable stages as countries develop. The Demographic Transition Model shows how birth rates, death rates, and total population change over time through five distinct stages.
Stage 1 (High Fluctuating) sees high birth and death rates, so population grows slowly. Stage 2 (Early Expanding) brings falling death rates whilst birth rates remain high, causing rapid population growth as families can afford better food, water, and healthcare.
Stage 3 (Late Expanding) shows birth rates dropping rapidly whilst death rates continue falling more slowly. Stage 4 (Low Fluctuating) reaches low birth and death rates, with birth rates fluctuating based on economic conditions.
Real-World Connection: The UK followed this exact pattern during industrialisation, which is why the model describes what actually happened there.
Stage 5 (Natural Decrease) sees birth rates fall below death rates due to ageing populations, causing natural population decline. However, the model has limitations - it can't predict sudden changes like HIV/AIDS impacts in Southern Africa, and it's based on industrialised countries' experiences, making it less relevant for non-industrialised nations.
We thought you’d never ask...
What is the Knowunity AI companion?
Our AI Companion is a student-focused AI tool that offers more than just answers. Built on millions of Knowunity resources, it provides relevant information, personalised study plans, quizzes, and content directly in the chat, adapting to your individual learning journey.
Where can I download the Knowunity app?
You can download the app from Google Play Store and Apple App Store.
Is Knowunity really free of charge?
That's right! Enjoy free access to study content, connect with fellow students, and get instant help – all at your fingertips.
Most popular content: Demographic Transition Model
1Most popular content in Geography
9U
Urbanisation - AQA GCSE Geography
Some questions on key knowledge from the Urbanisation topic in GCSE Geography
97950
T
topic one- hazards flashcards set 1
Explore the fascinating world of geography with these flashcards covering diverse topics like continents, landmarks, and natural wonders. Enhance your knowledge and ace your exams!
114660
AQA GCSE Geography Paper 1 revision notes (excl. case studies)
Revision notes for the AQA GCSE Geography specification. Does not include case studies as they are selected by the school.
93,76986
Geography Hazards & Landscapes
Explore key concepts in AQA Geography, covering rivers, coasts, natural hazards, and ecosystems. This summary highlights essential topics such as river processes, coastal management, desertification, and case studies on earthquakes and tropical storms. Ideal for exam preparation and understanding geographical systems.
103,063117
I
Introduction to Natural Hazard Types
Identify the differences between geological and meteorological hazards and understand the factors affecting hazard risk.
S32830
E
Exploring Natural Hazards: Causes and Effects
Discover the primary causes and common effects of natural hazards such as tsunamis, volcanic eruptions, hurricanes, wildfires, droughts, landslides, and more!
113110
P
Paper 1? Down what else
Explore the fascinating world of geography with these flashcards covering diverse topics like continents, landmarks, and natural wonders. Enhance your knowledge and ace your exams!
114692
Rio de Janeiro case study
AQA geography gcse
1094126
OCR B Geography Case Studies
Comprehensive revision notes covering key OCR B Geography case studies, including topics on climate change, urbanization, food security, and natural hazards. This resource is designed to aid students in understanding geographical concepts and preparing for exams effectively. Key case studies include Typhoon Haiyan, urban growth in Rio, and sustainable development practices in Tanzania.
102,00337
Most popular content
9Sociology of Education Overview
Explore comprehensive A-Level Sociology notes on the education system, covering key theories, policies, and sociological perspectives. This resource includes insights on marketisation, gender roles, cultural deprivation, and educational inequalities, providing a thorough understanding of how education shapes social stratification and individual achievement. Ideal for exam preparation and in-depth study.
12102,8093,040
Sociology of Families: Comprehensive Revision
Dive into an extensive overview of family dynamics, perspectives, and patterns in sociology. This resource covers key concepts such as family diversity, gender roles, marriage, and the impact of social policies on family structures. Perfect for A-Level Sociology students preparing for Paper 2.
1273,5592,306
Criminology: Crime & Punishment Overview
Comprehensive mindmaps covering key concepts in the Crime and Punishment topic for WJEC Criminology Unit 4. This resource includes detailed insights into the Criminal Justice System, crime prevention strategies, sentencing models, and the roles of various agencies. Ideal for A-Level revision, ensuring you grasp essential theories and legislative processes to excel in your exams.
1254,8531,059
Comprehensive Crime & Deviance Overview
Explore an extensive revision of crime and deviance topics, including theories, types of crime, and the impact of media. This resource covers key concepts such as Marxism, functionalism, gender and crime, and the influence of globalization on criminal behavior. Ideal for students seeking a thorough understanding of criminology and its various theories. Type: Full Topic Revision.
1251,6321,399
An Inspector Calls: Character Insights
Explore in-depth analysis and key quotes for characters in J.B. Priestley's 'An Inspector Calls'. This resource covers Gerald Croft, Inspector Goole, Sheila Birling, Mrs. Birling, Eric Birling, and Eva Smith, focusing on themes of class, gender roles, and social responsibility. Ideal for students aiming for Grade 8 and above.
1025,412907
WJEC Unit 4 Criminology
Criminology unit 4 detailed revision note
127,146125
C
Cell Biology and Cell structure
cell structures
93,1870
Criminology Theories Overview
Explore key criminology theories and their implications on crime and deviance. This comprehensive summary covers biological, psychological, and sociological perspectives, including labelling theory, right realism, and the impact of social campaigns on policy development. Ideal for A-Level criminology students seeking to understand the complexities of criminal behaviour and the factors influencing crime prevention strategies.
129,754210
Romeo and Juliet: Key themes
Key Romeo and Juliet themes and analysed quotes
106,695198
Can't find what you're looking for? Explore other subjects.
Students love us — and so will you.
4.6/5App Store
4.7/5Google Play
The app is very easy to use and well designed. I have found everything I was looking for so far and have been able to learn a lot from the presentations! I will definitely use the app for a class assignment! And of course it also helps a lot as an inspiration.
Stefan SiOS user
This app is really great. There are so many study notes and help [...]. My problem subject is French, for example, and the app has so many options for help. Thanks to this app, I have improved my French. I would recommend it to anyone.
Samantha KlichAndroid user
Wow, I am really amazed. I just tried the app because I've seen it advertised many times and was absolutely stunned. This app is THE HELP you want for school and above all, it offers so many things, such as workouts and fact sheets, which have been VERY helpful to me personally.
AnnaiOS user